Initial Results - determining initial drug sensitivity
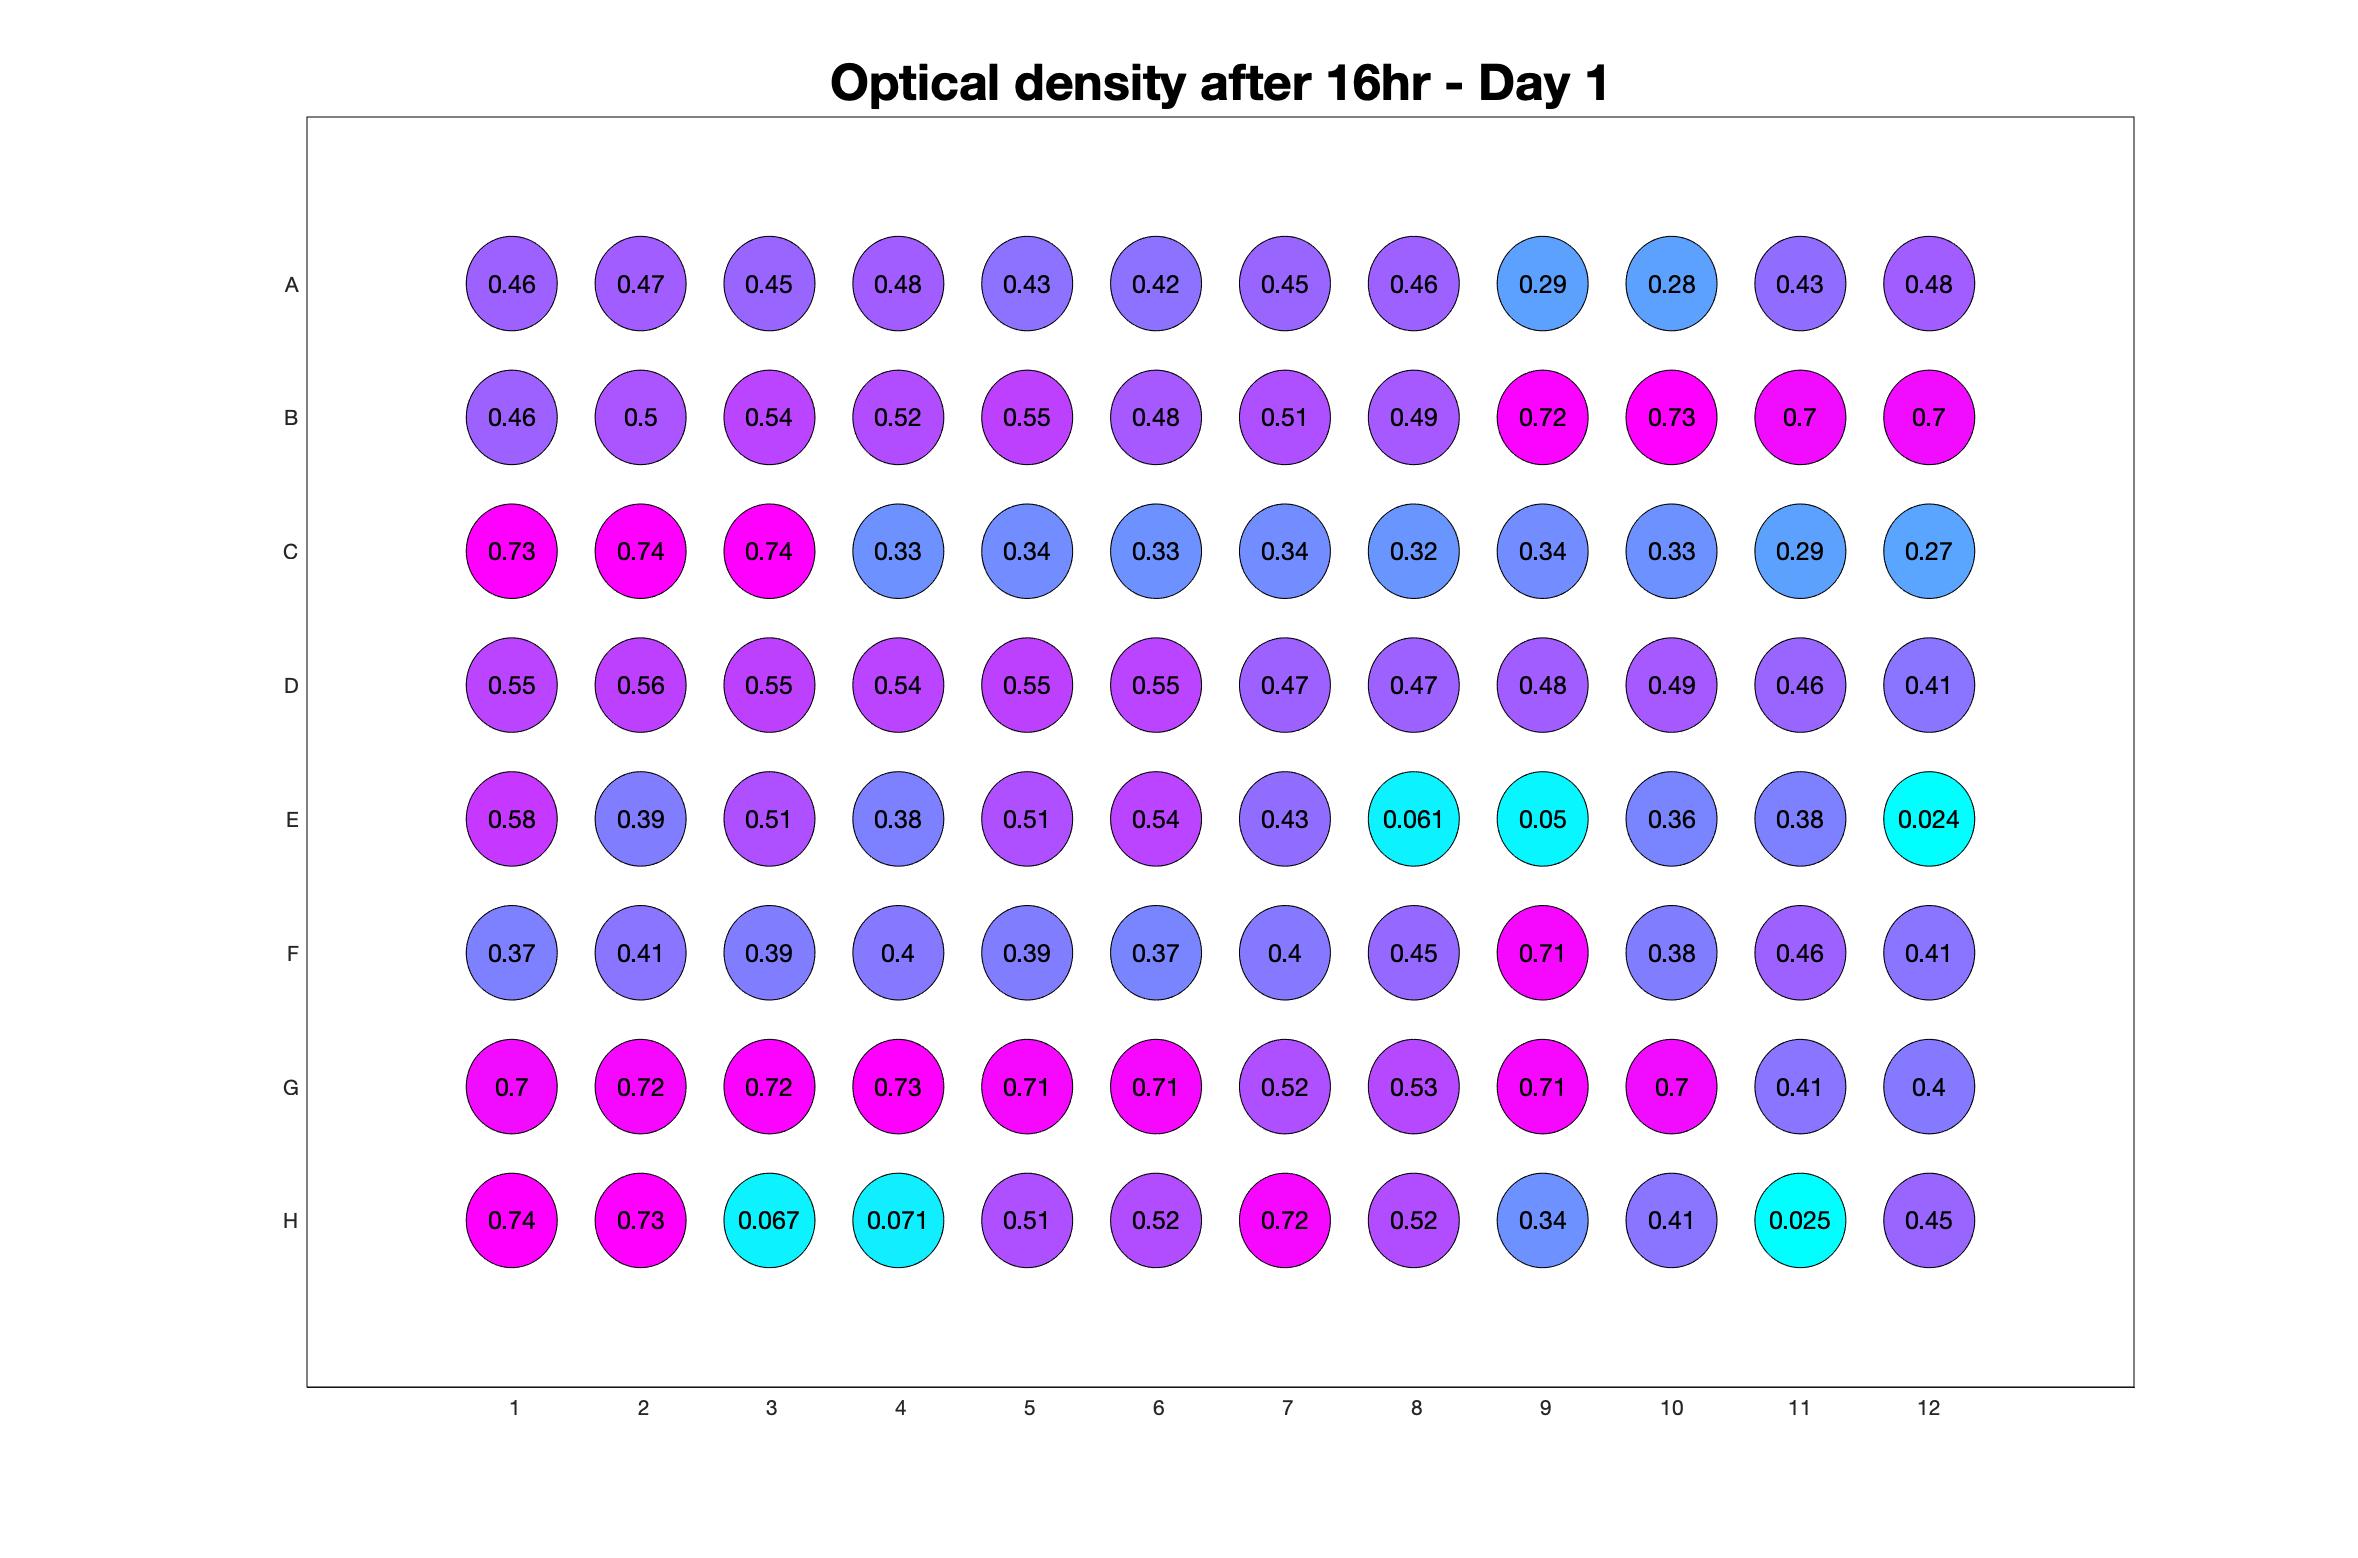
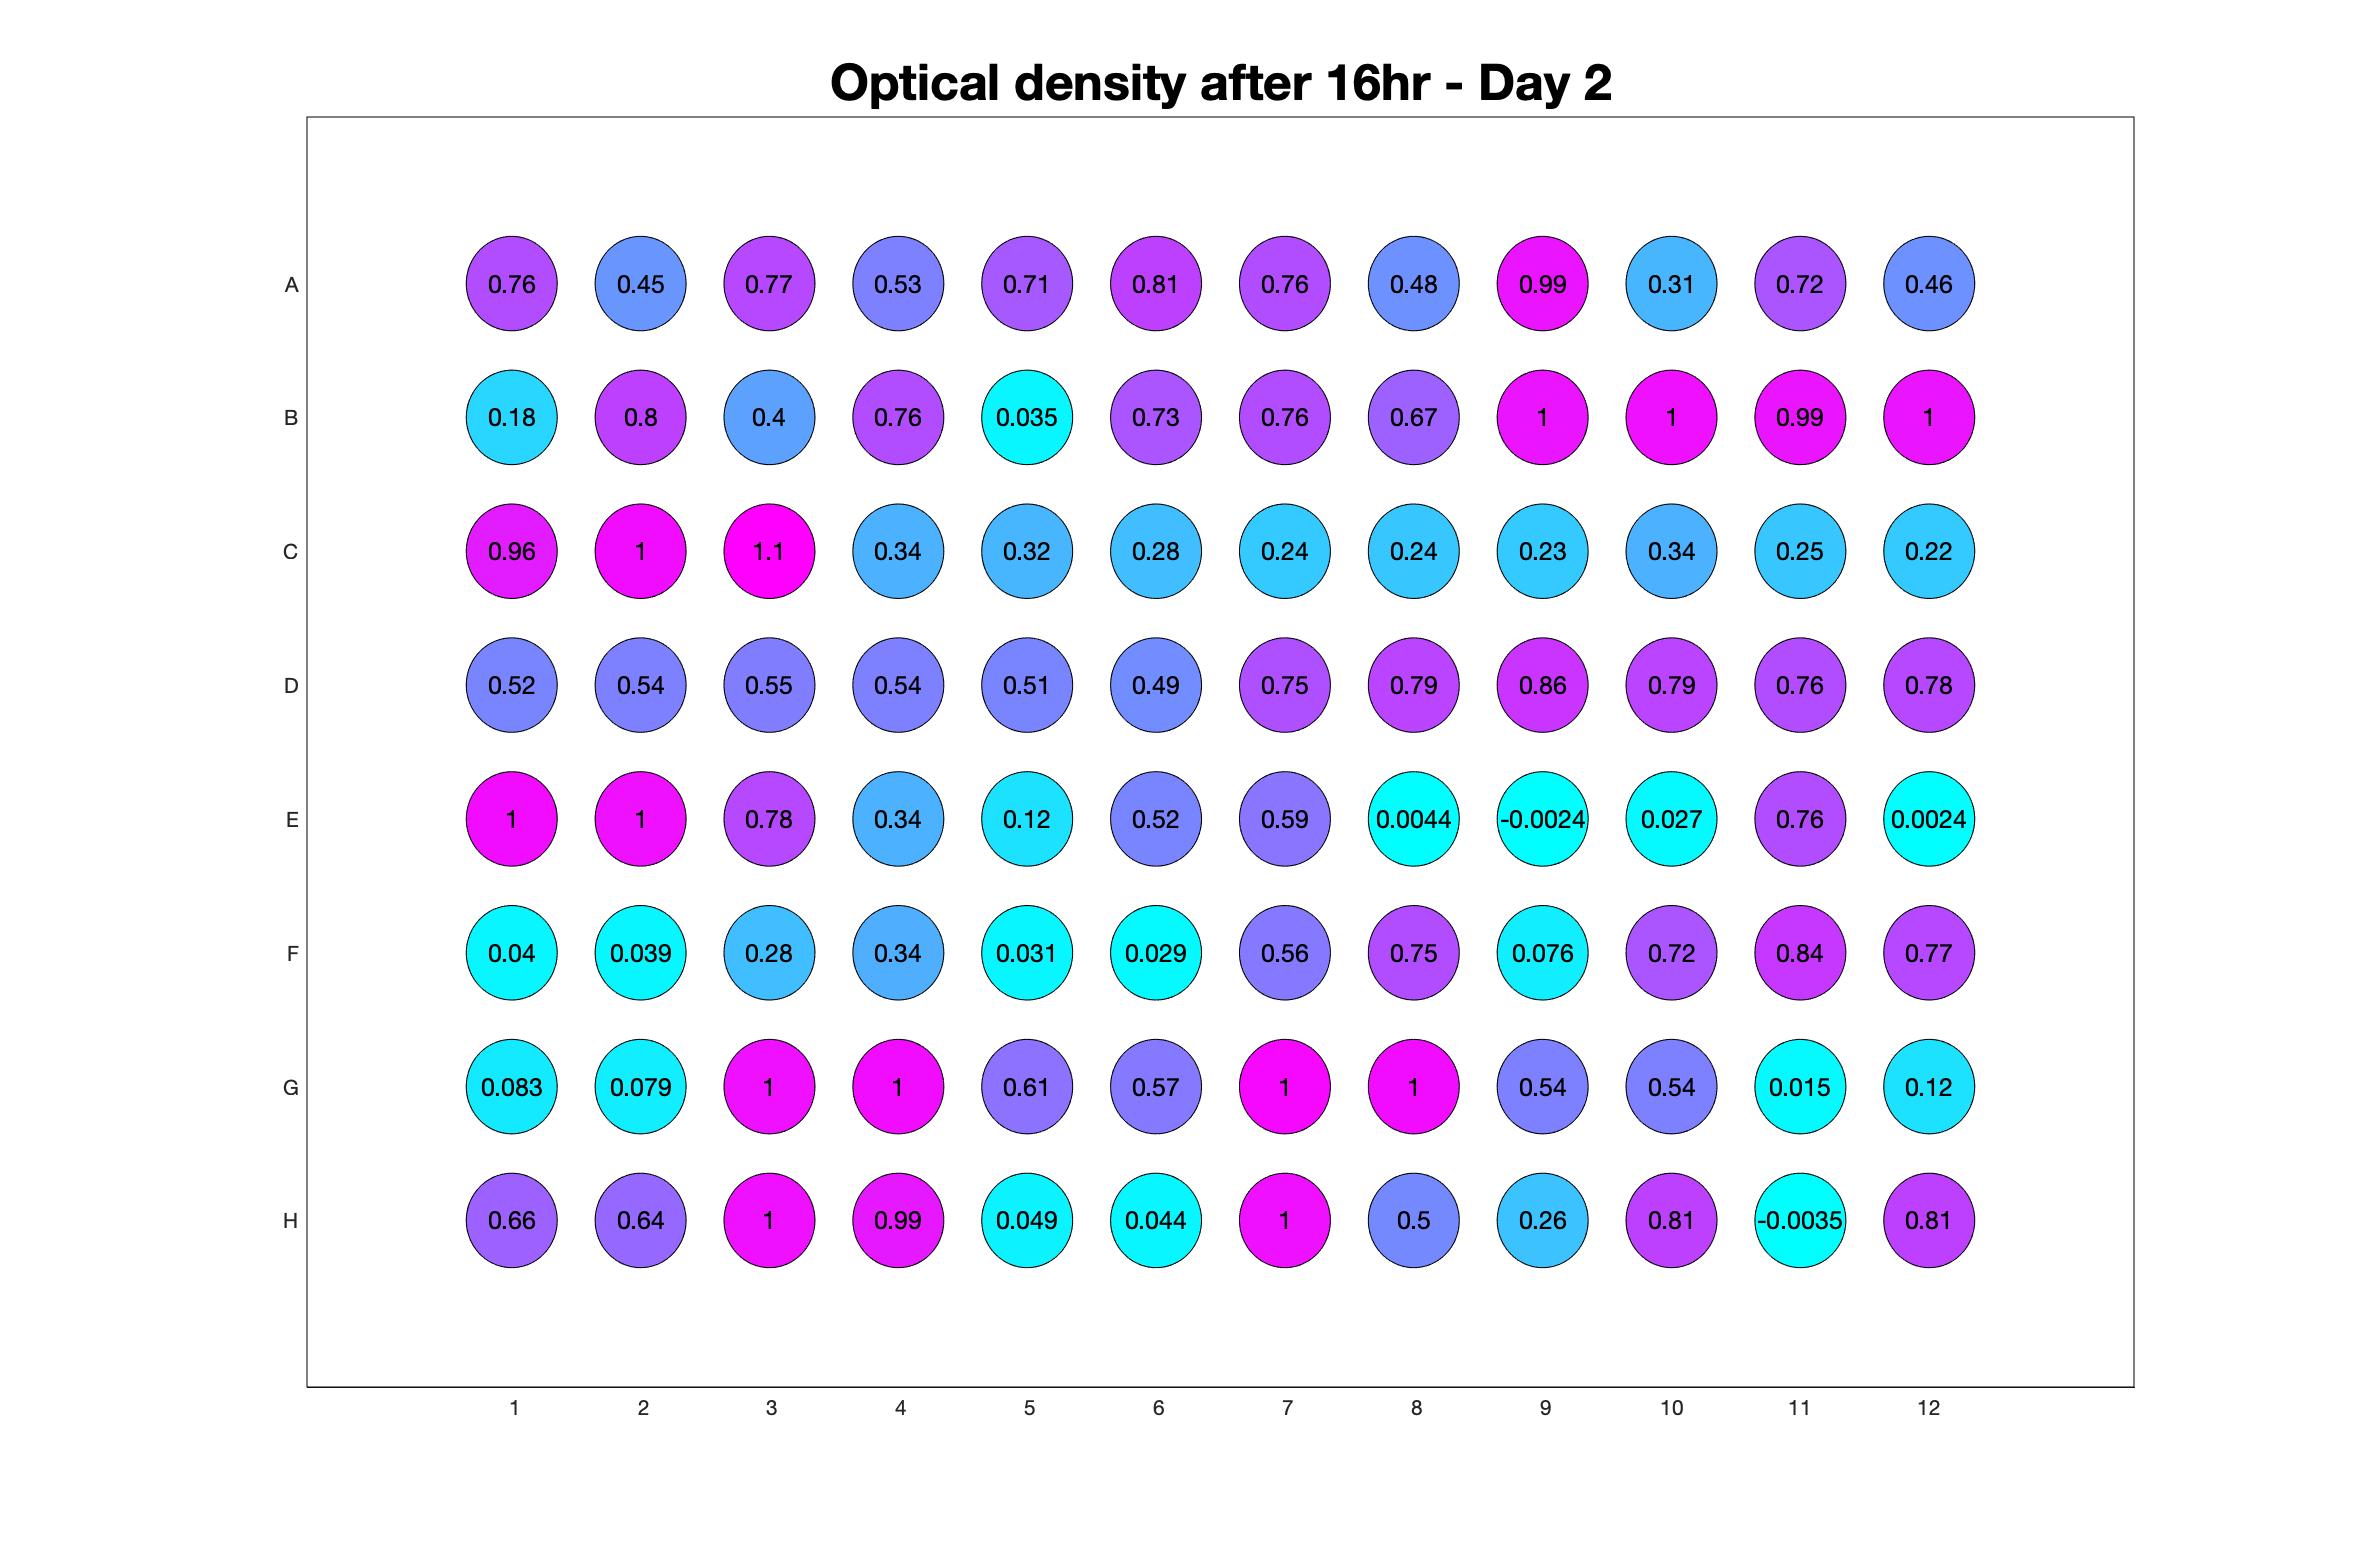
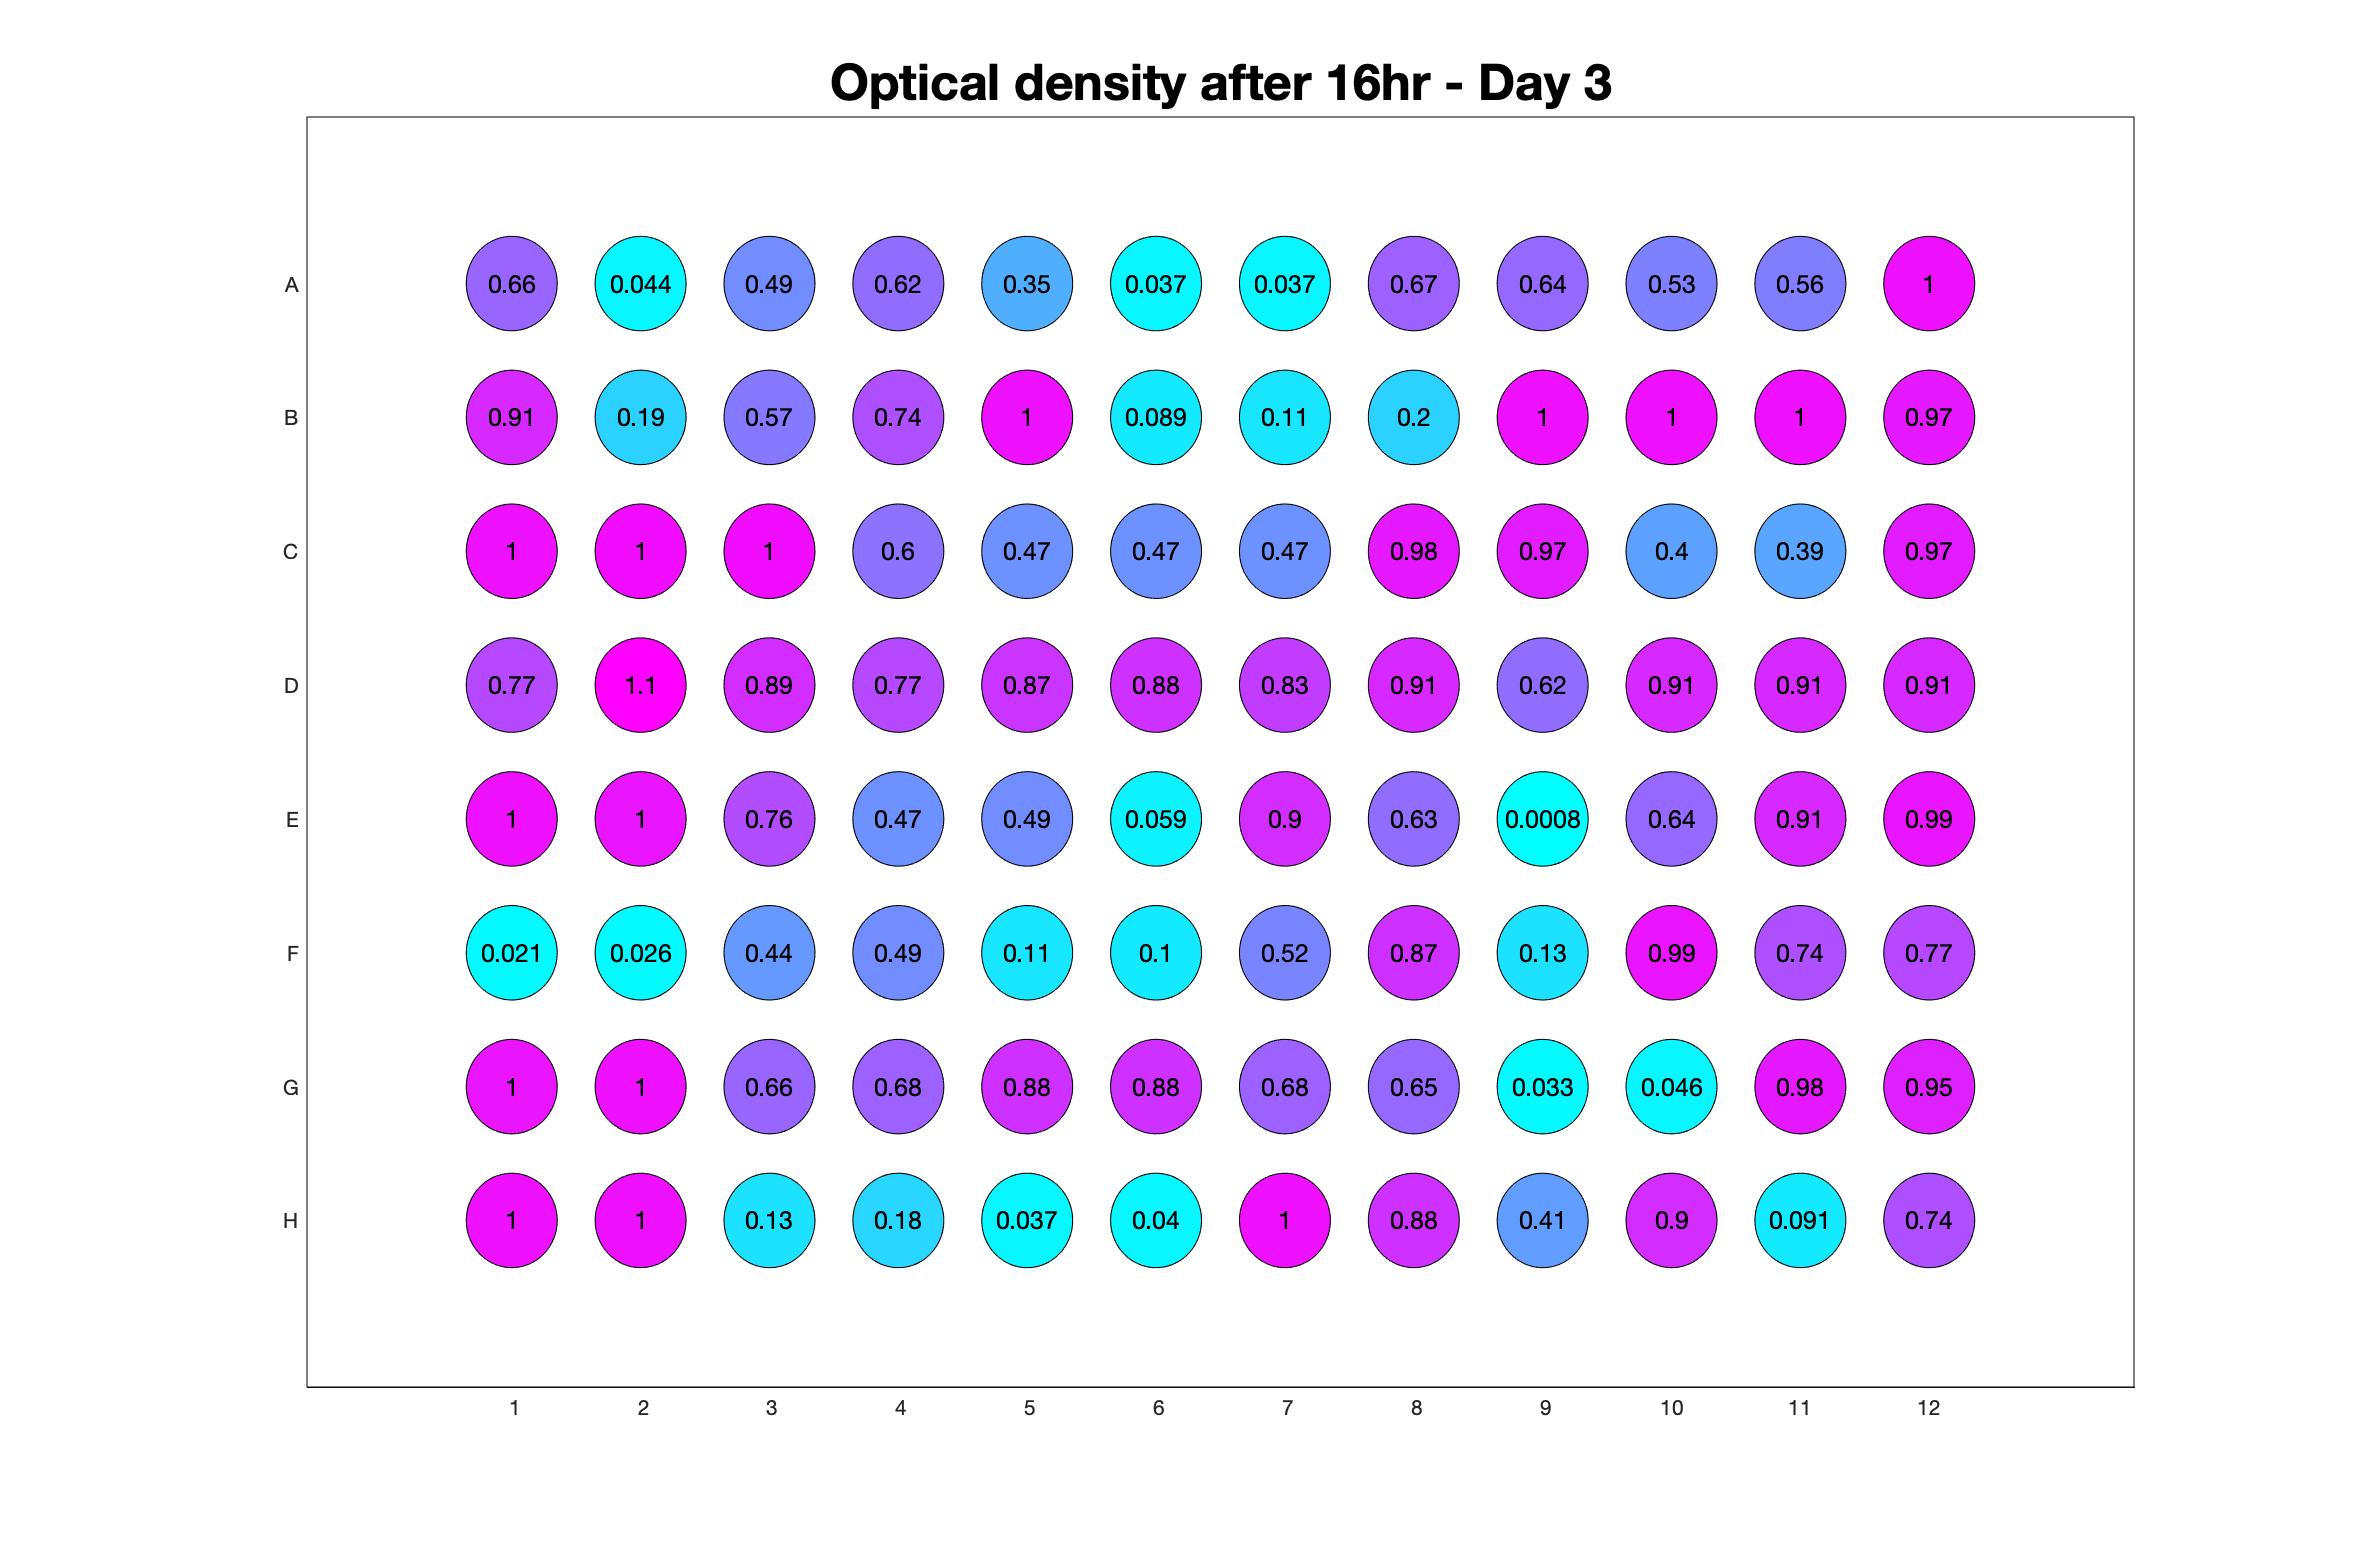
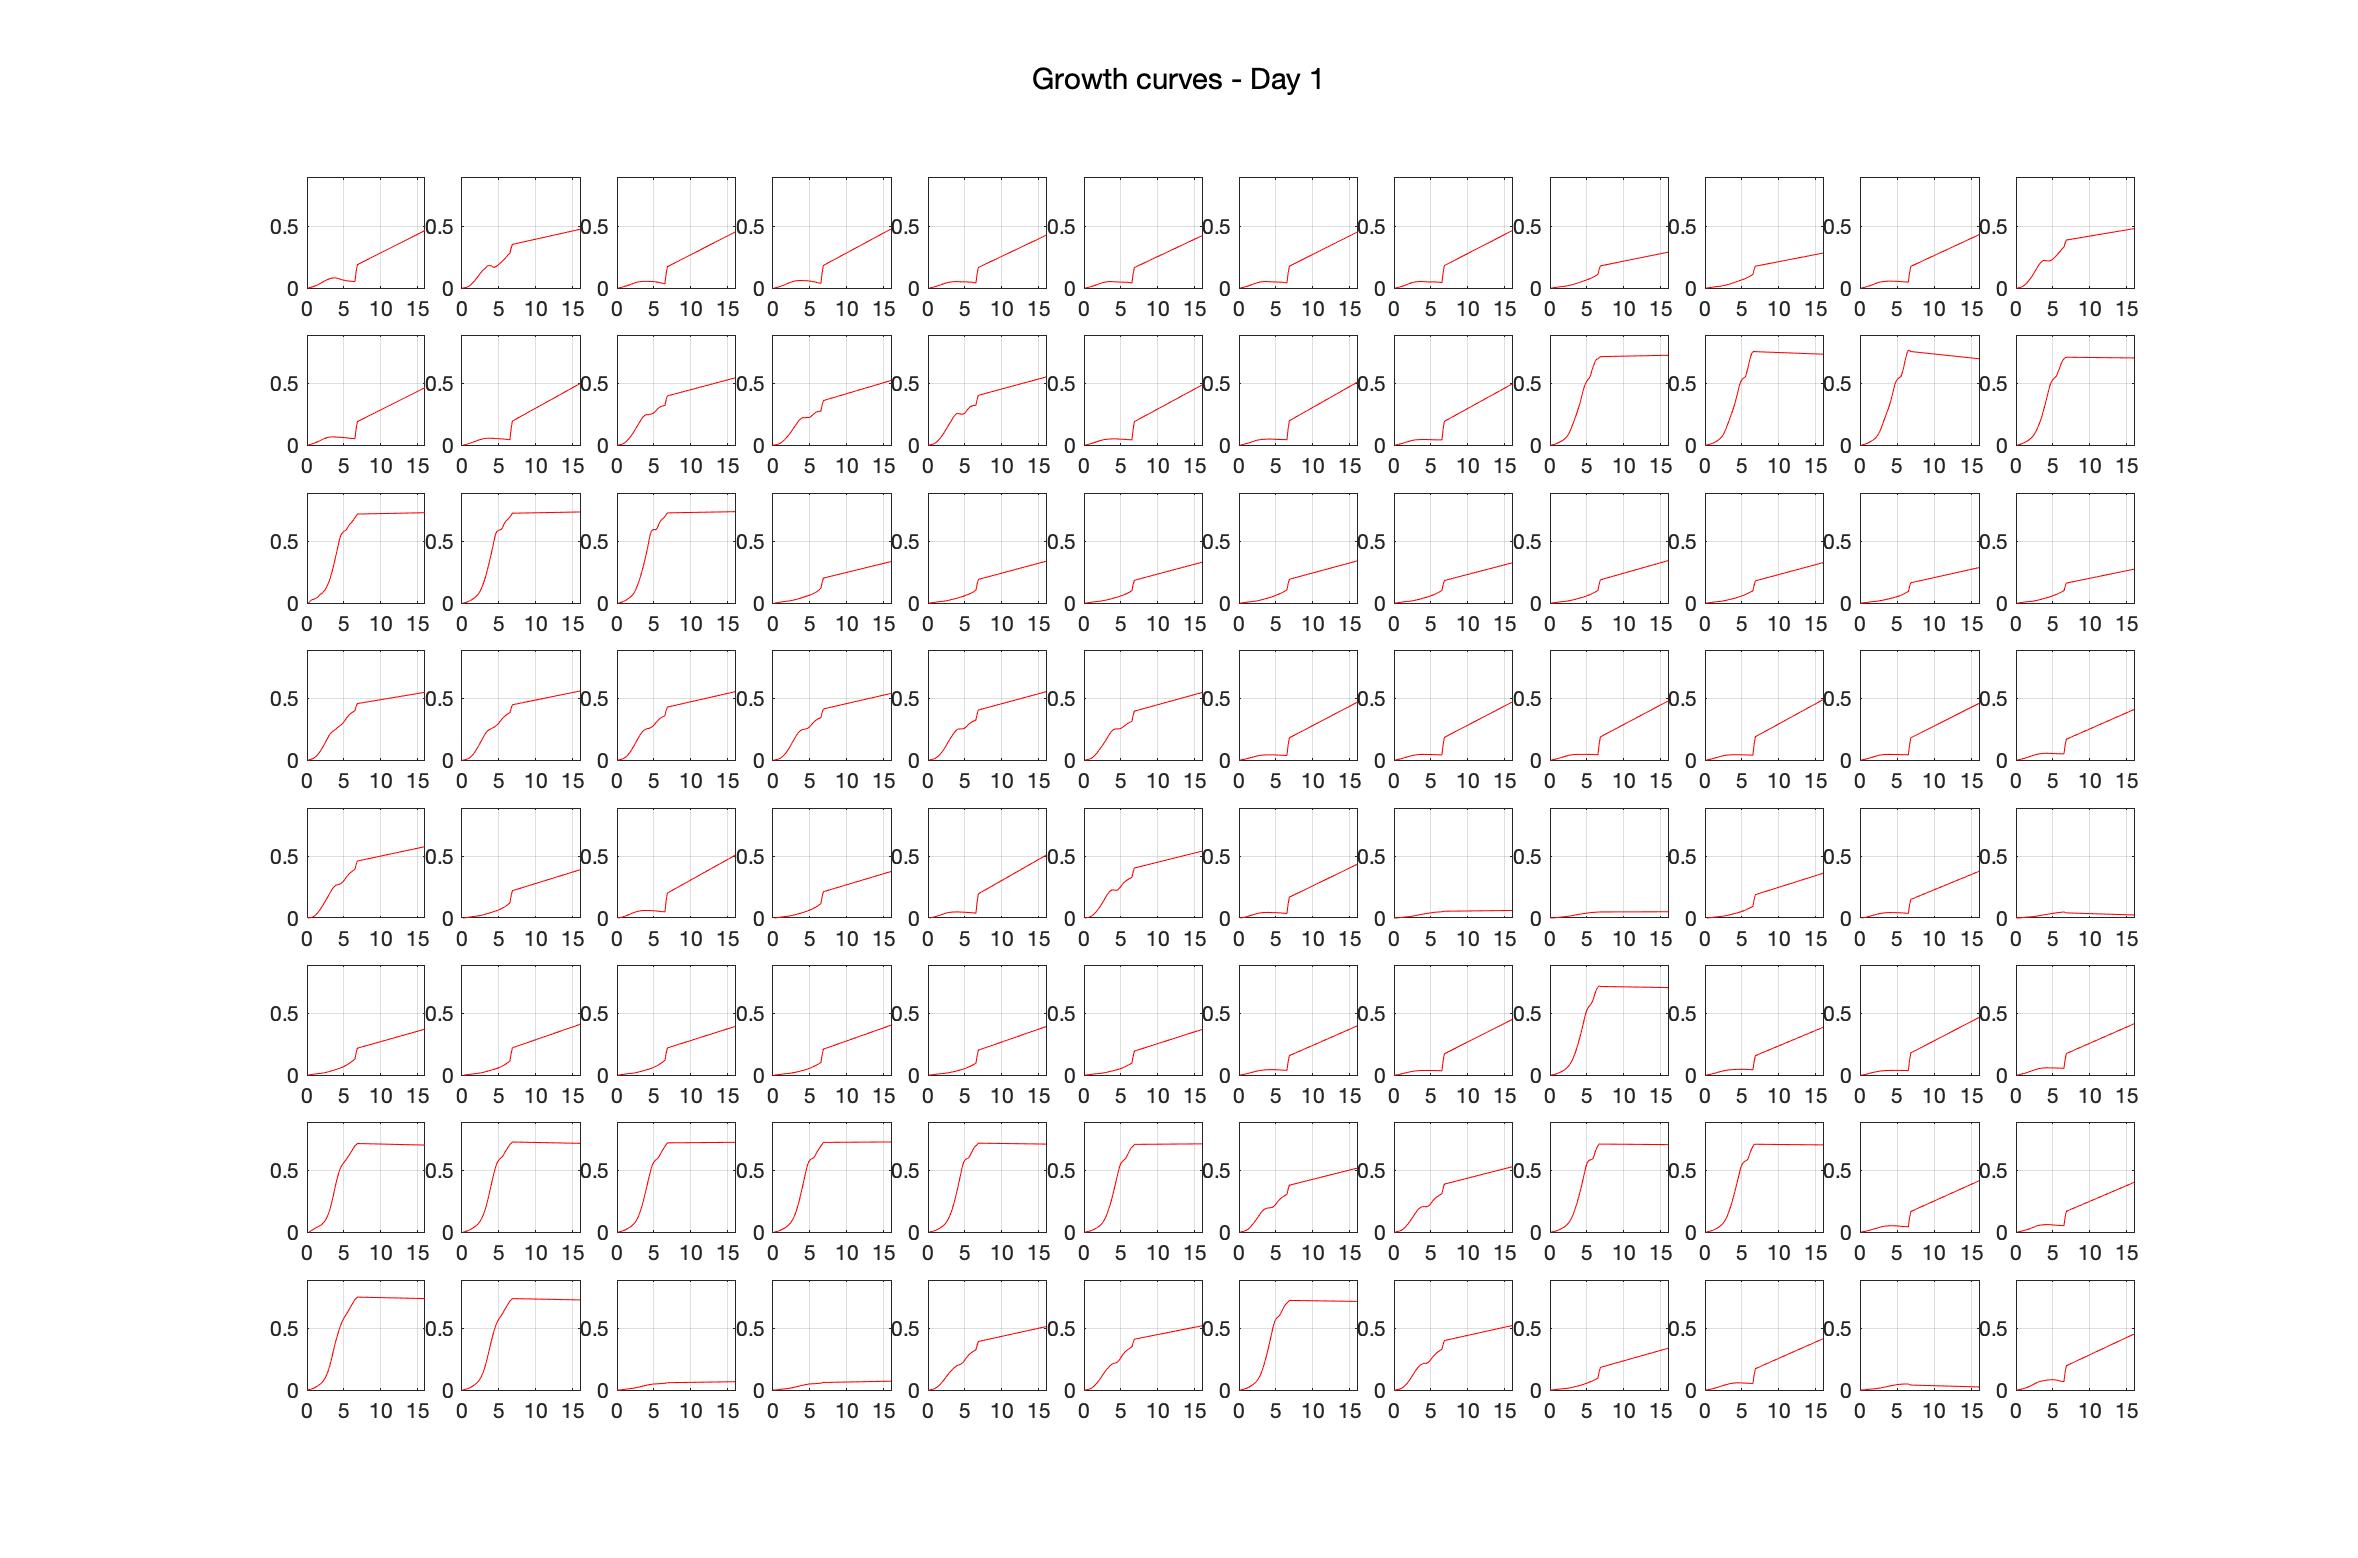
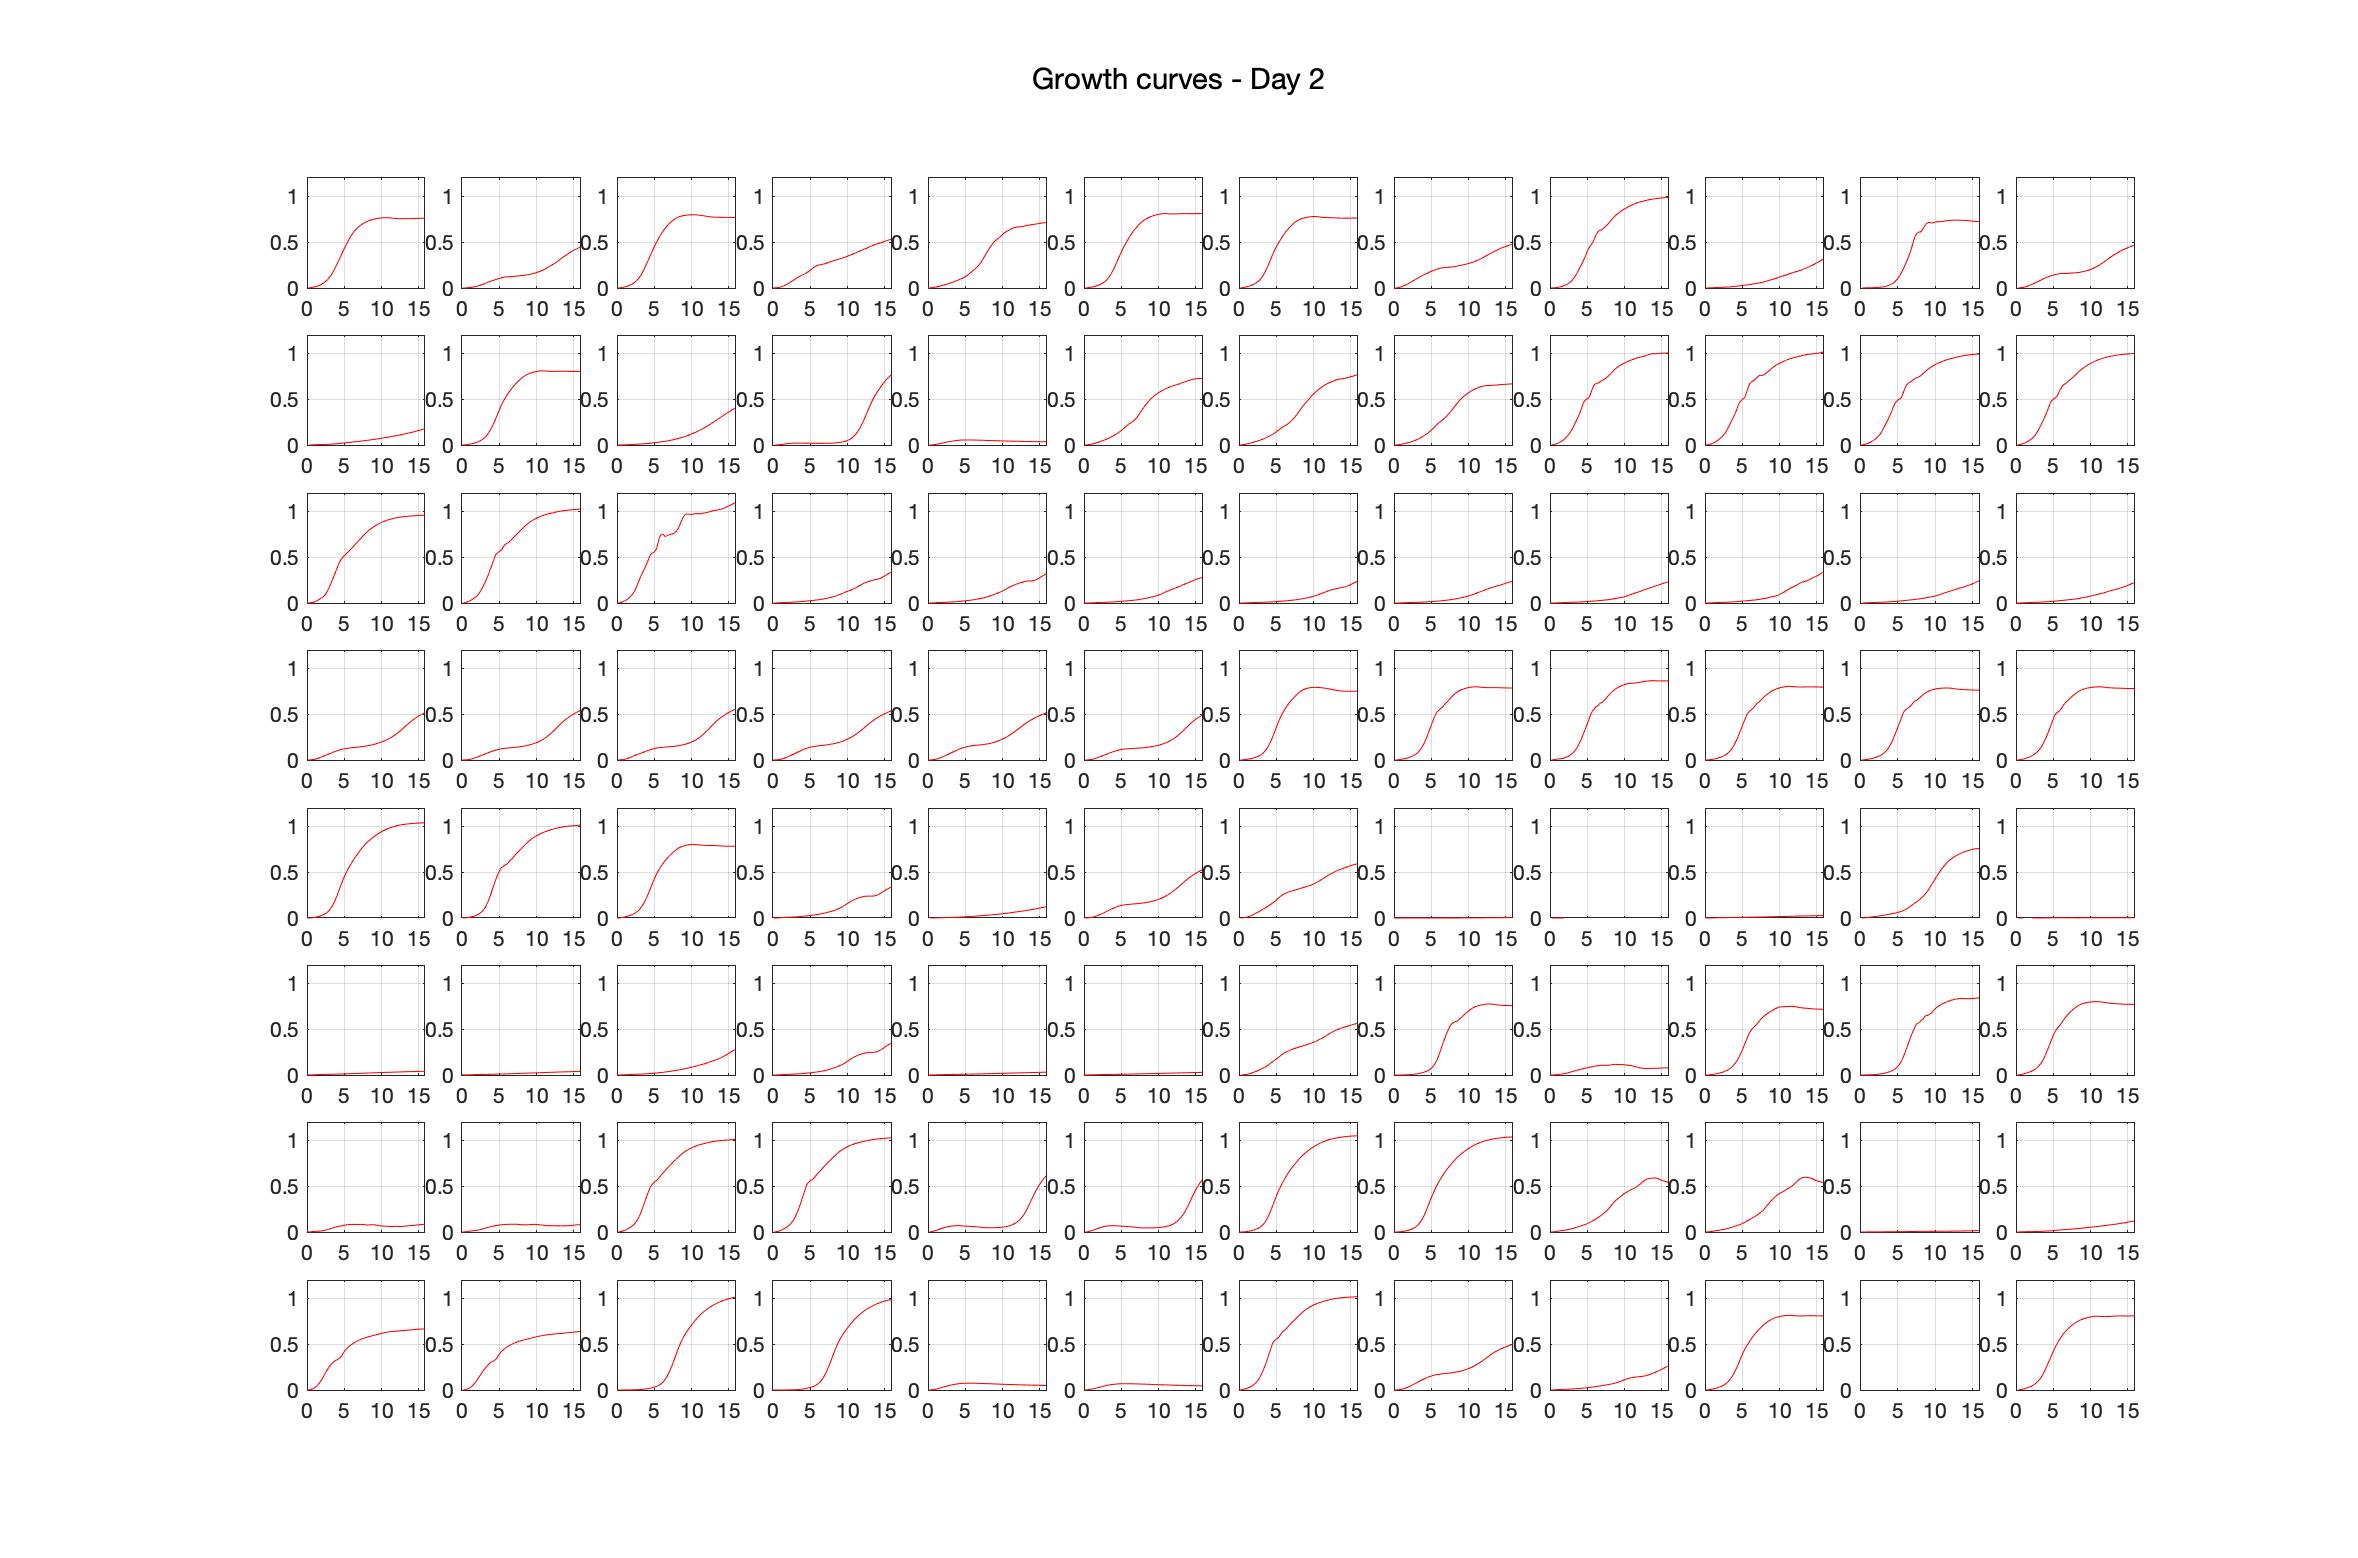
Monitoring bacterial growth on different antibiotics concentrations allows us to infer what is the minimum inhibitory concentration (MIC) for each antibiotic type. Antibiotic concentration around the EC50 (the concentration of a drug that gives half-maximal response) are a good starting point for the experimental evolution. In these examples, we defined the EC50 as the concentrations the result in an optical density that is half of the optical density without the drug (after 16h of growth). The EC50 concentrations chosen for the evolution experiment are marked in RED.

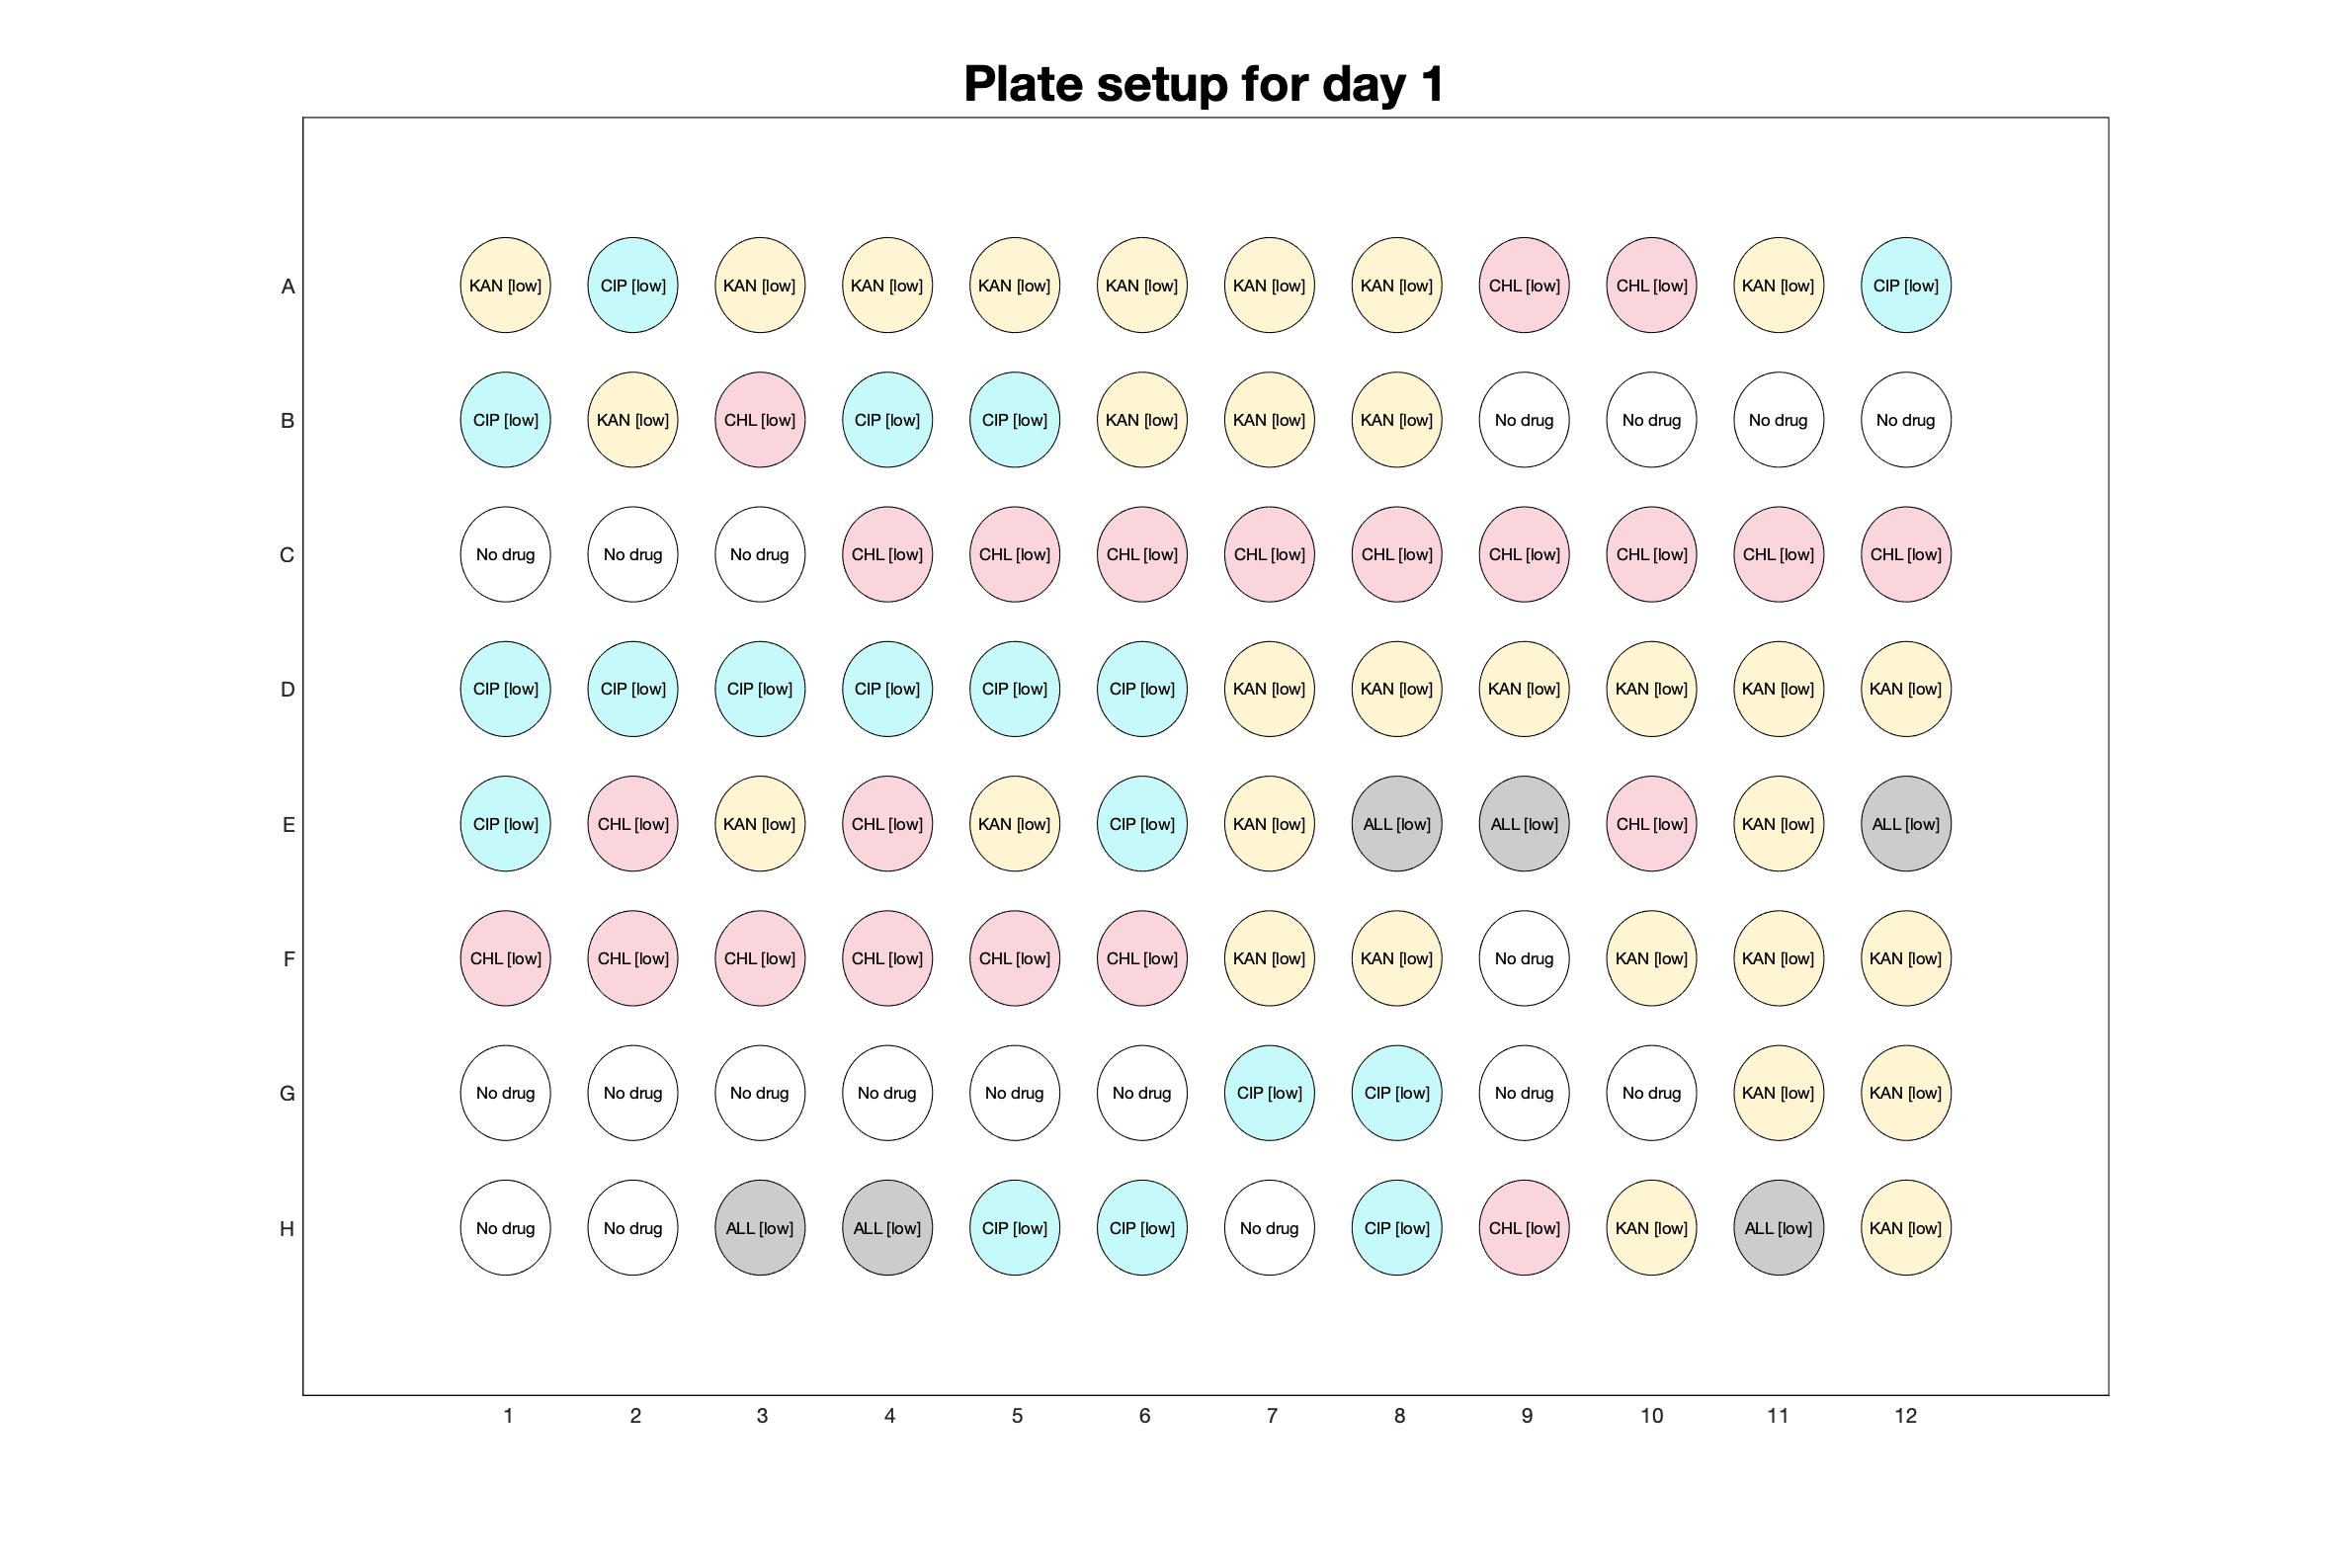
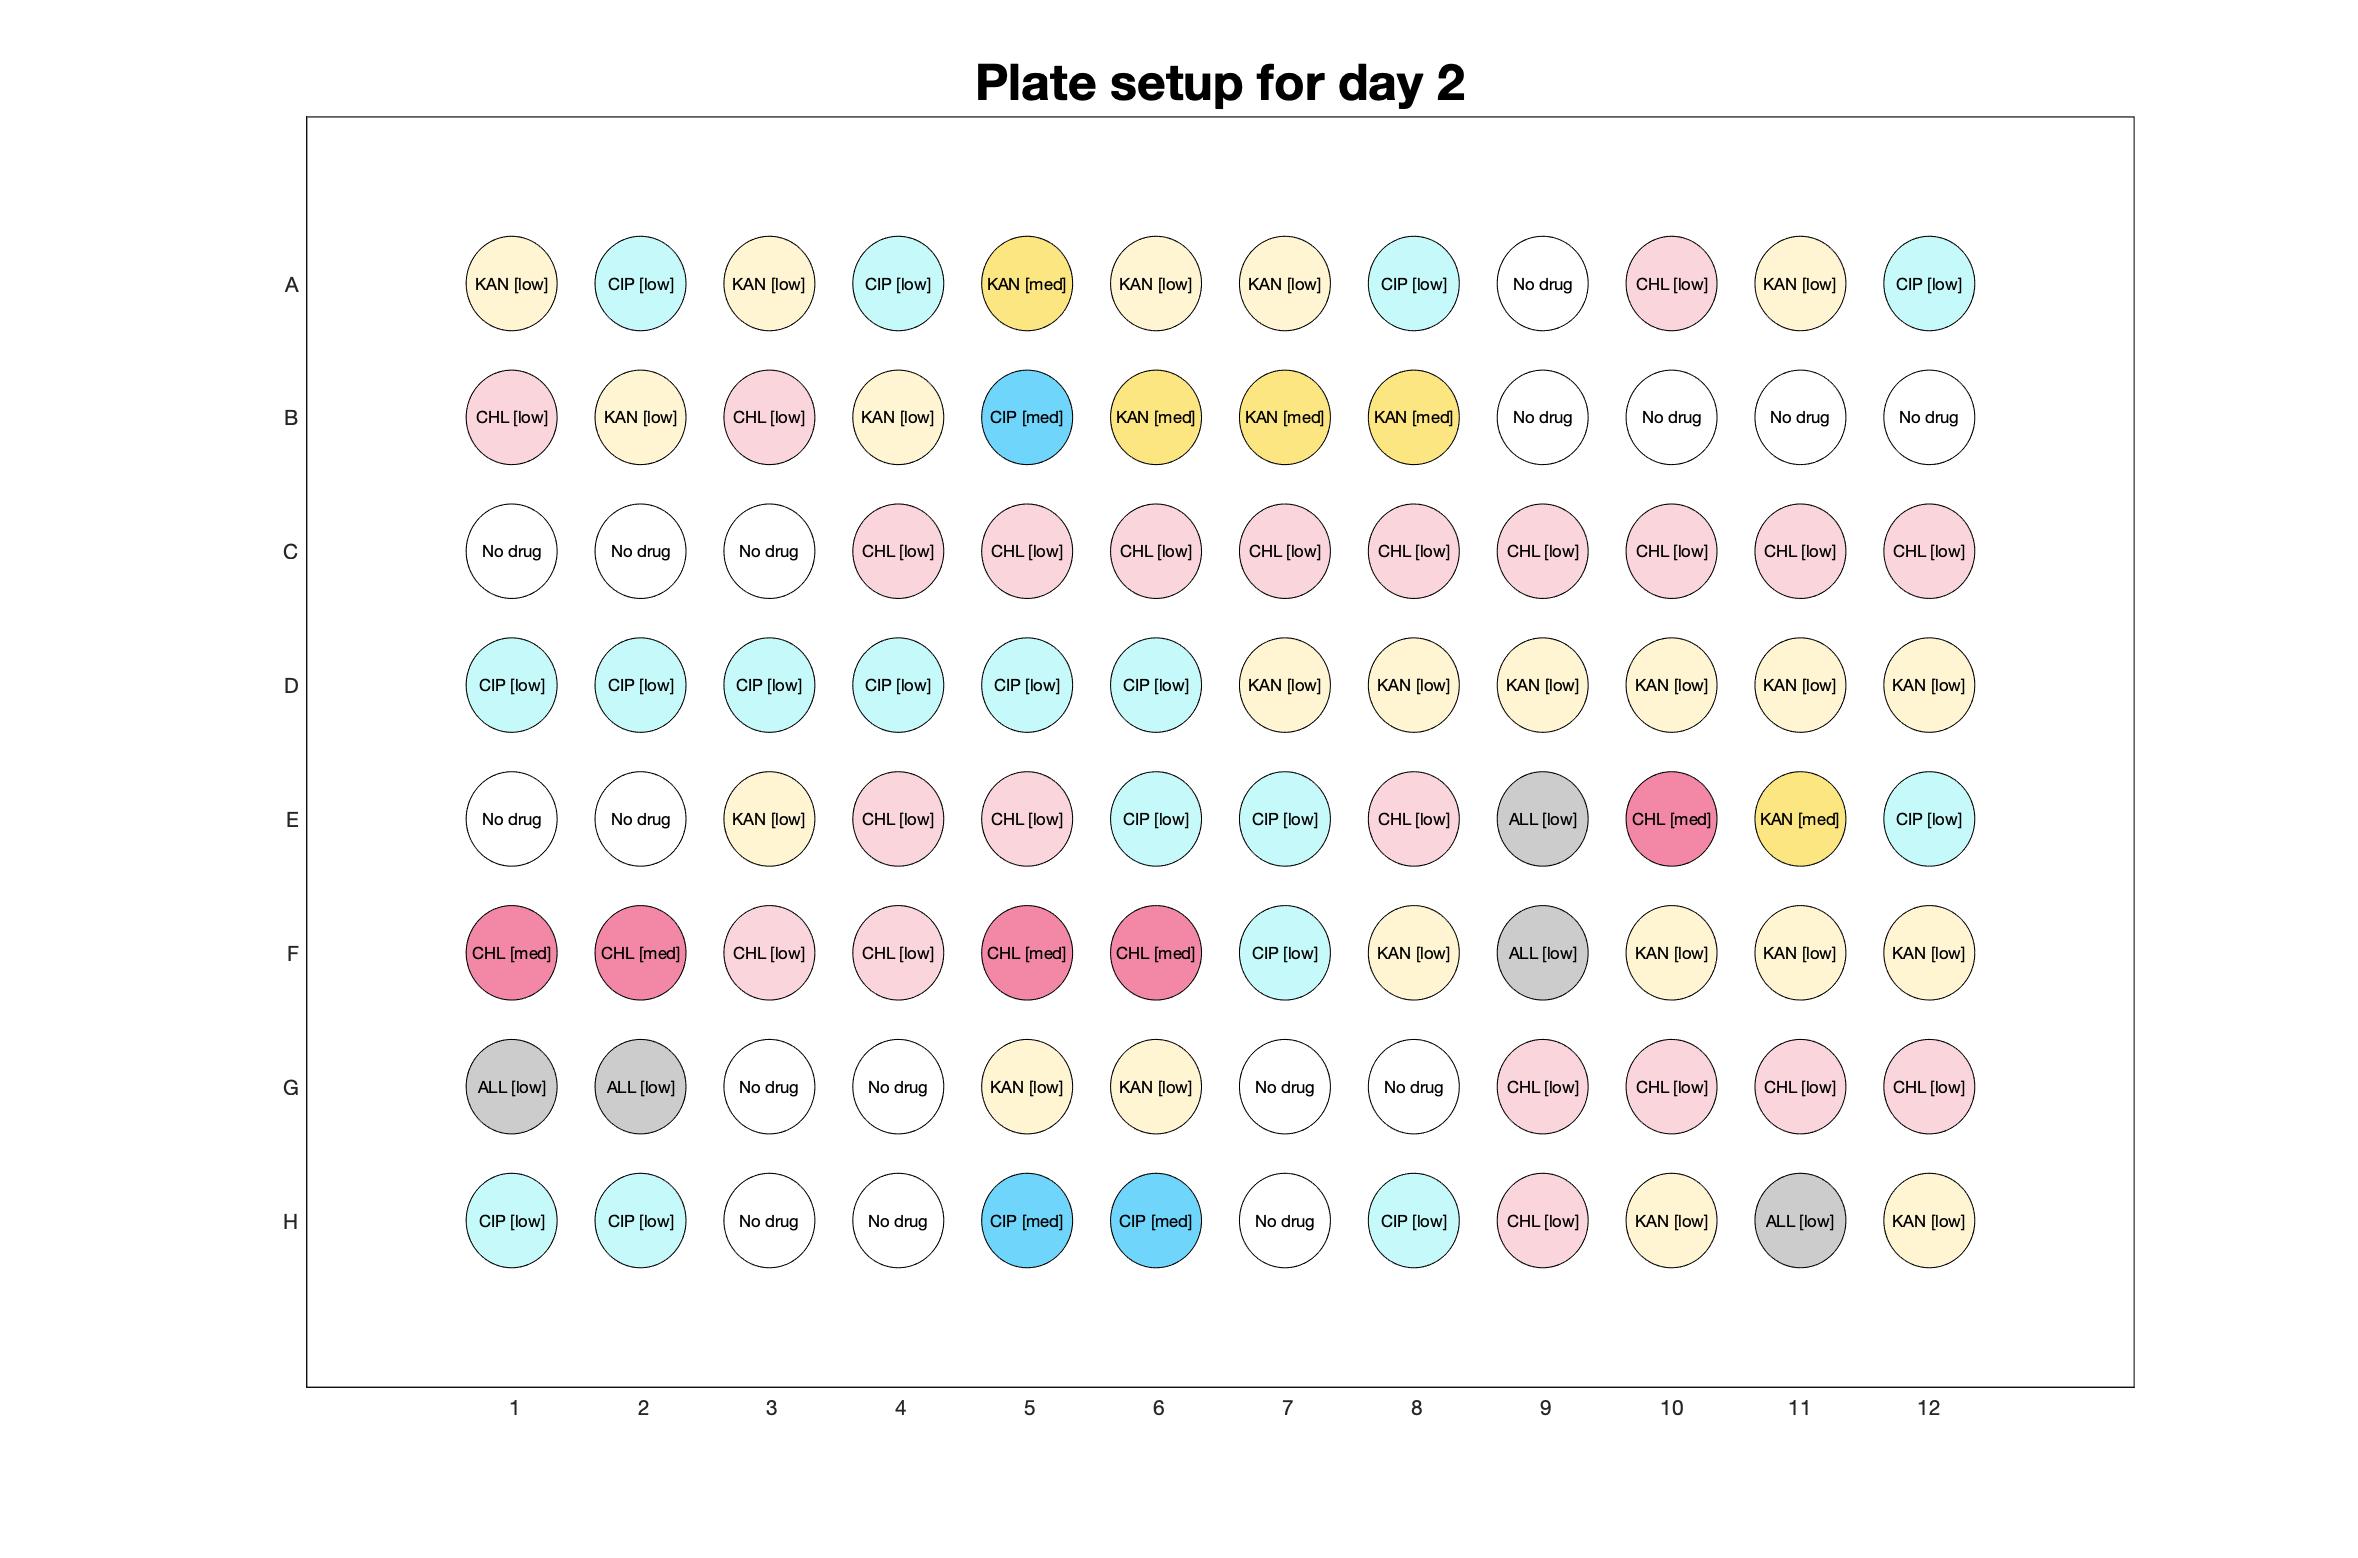
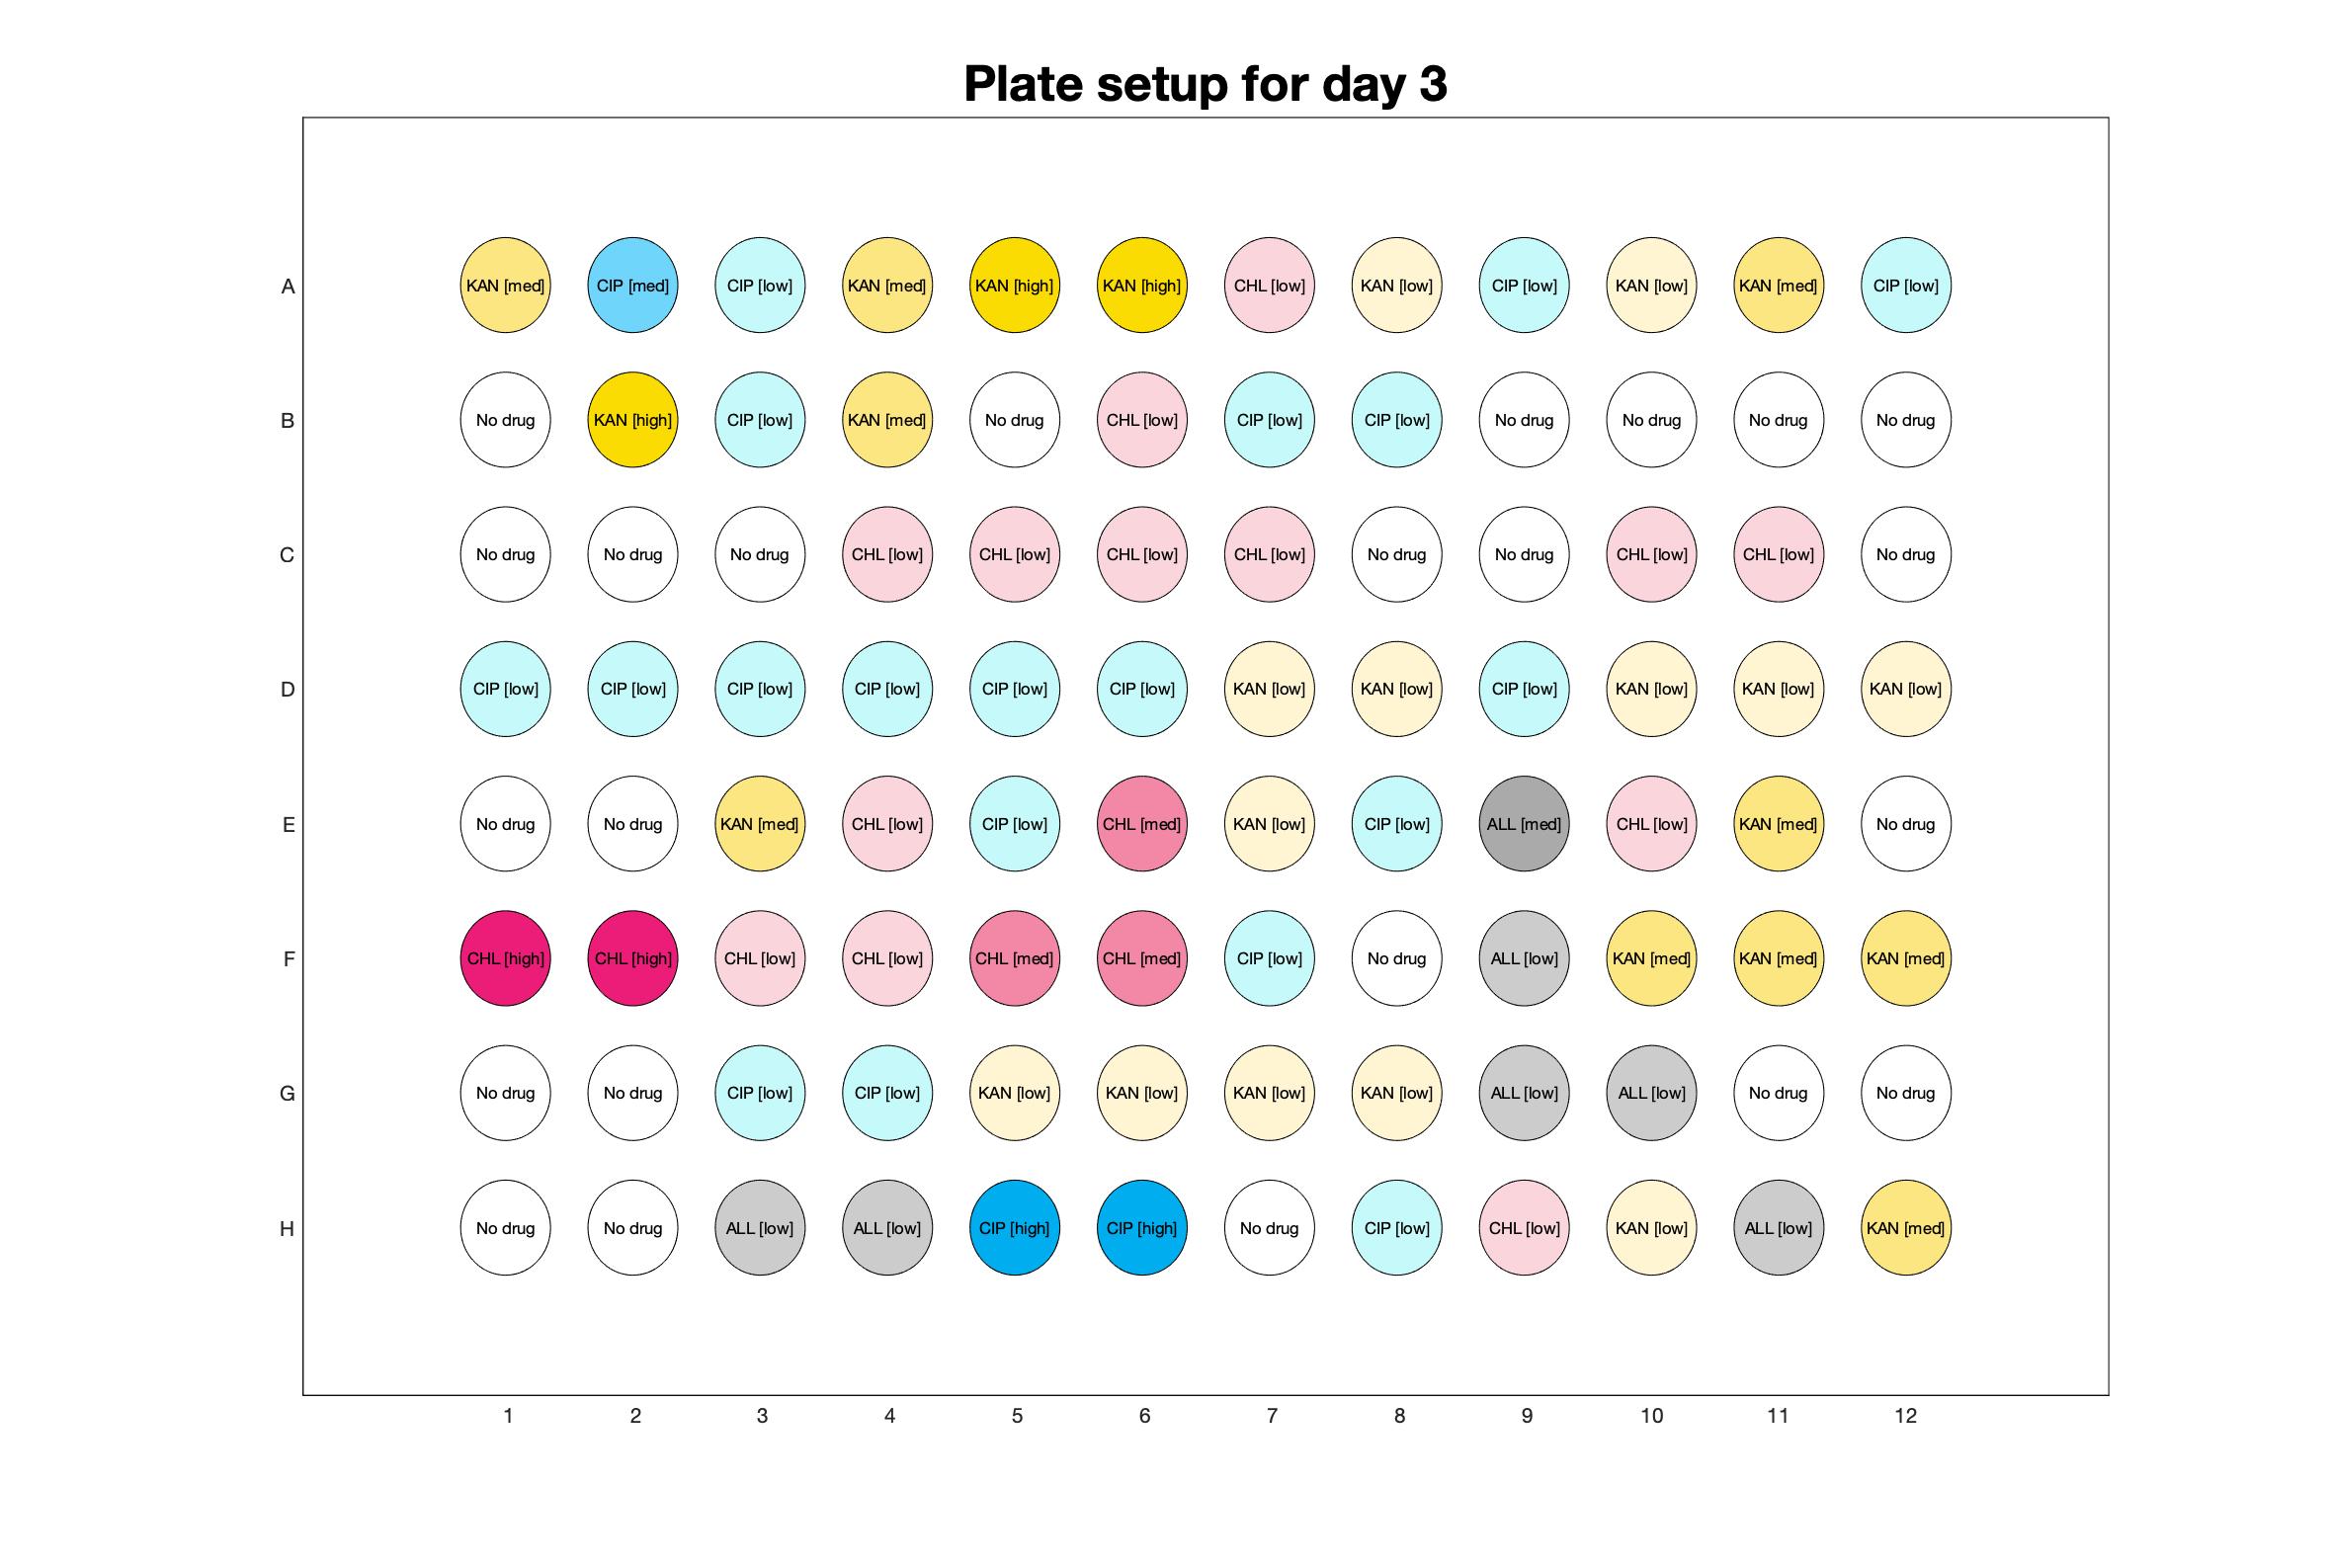
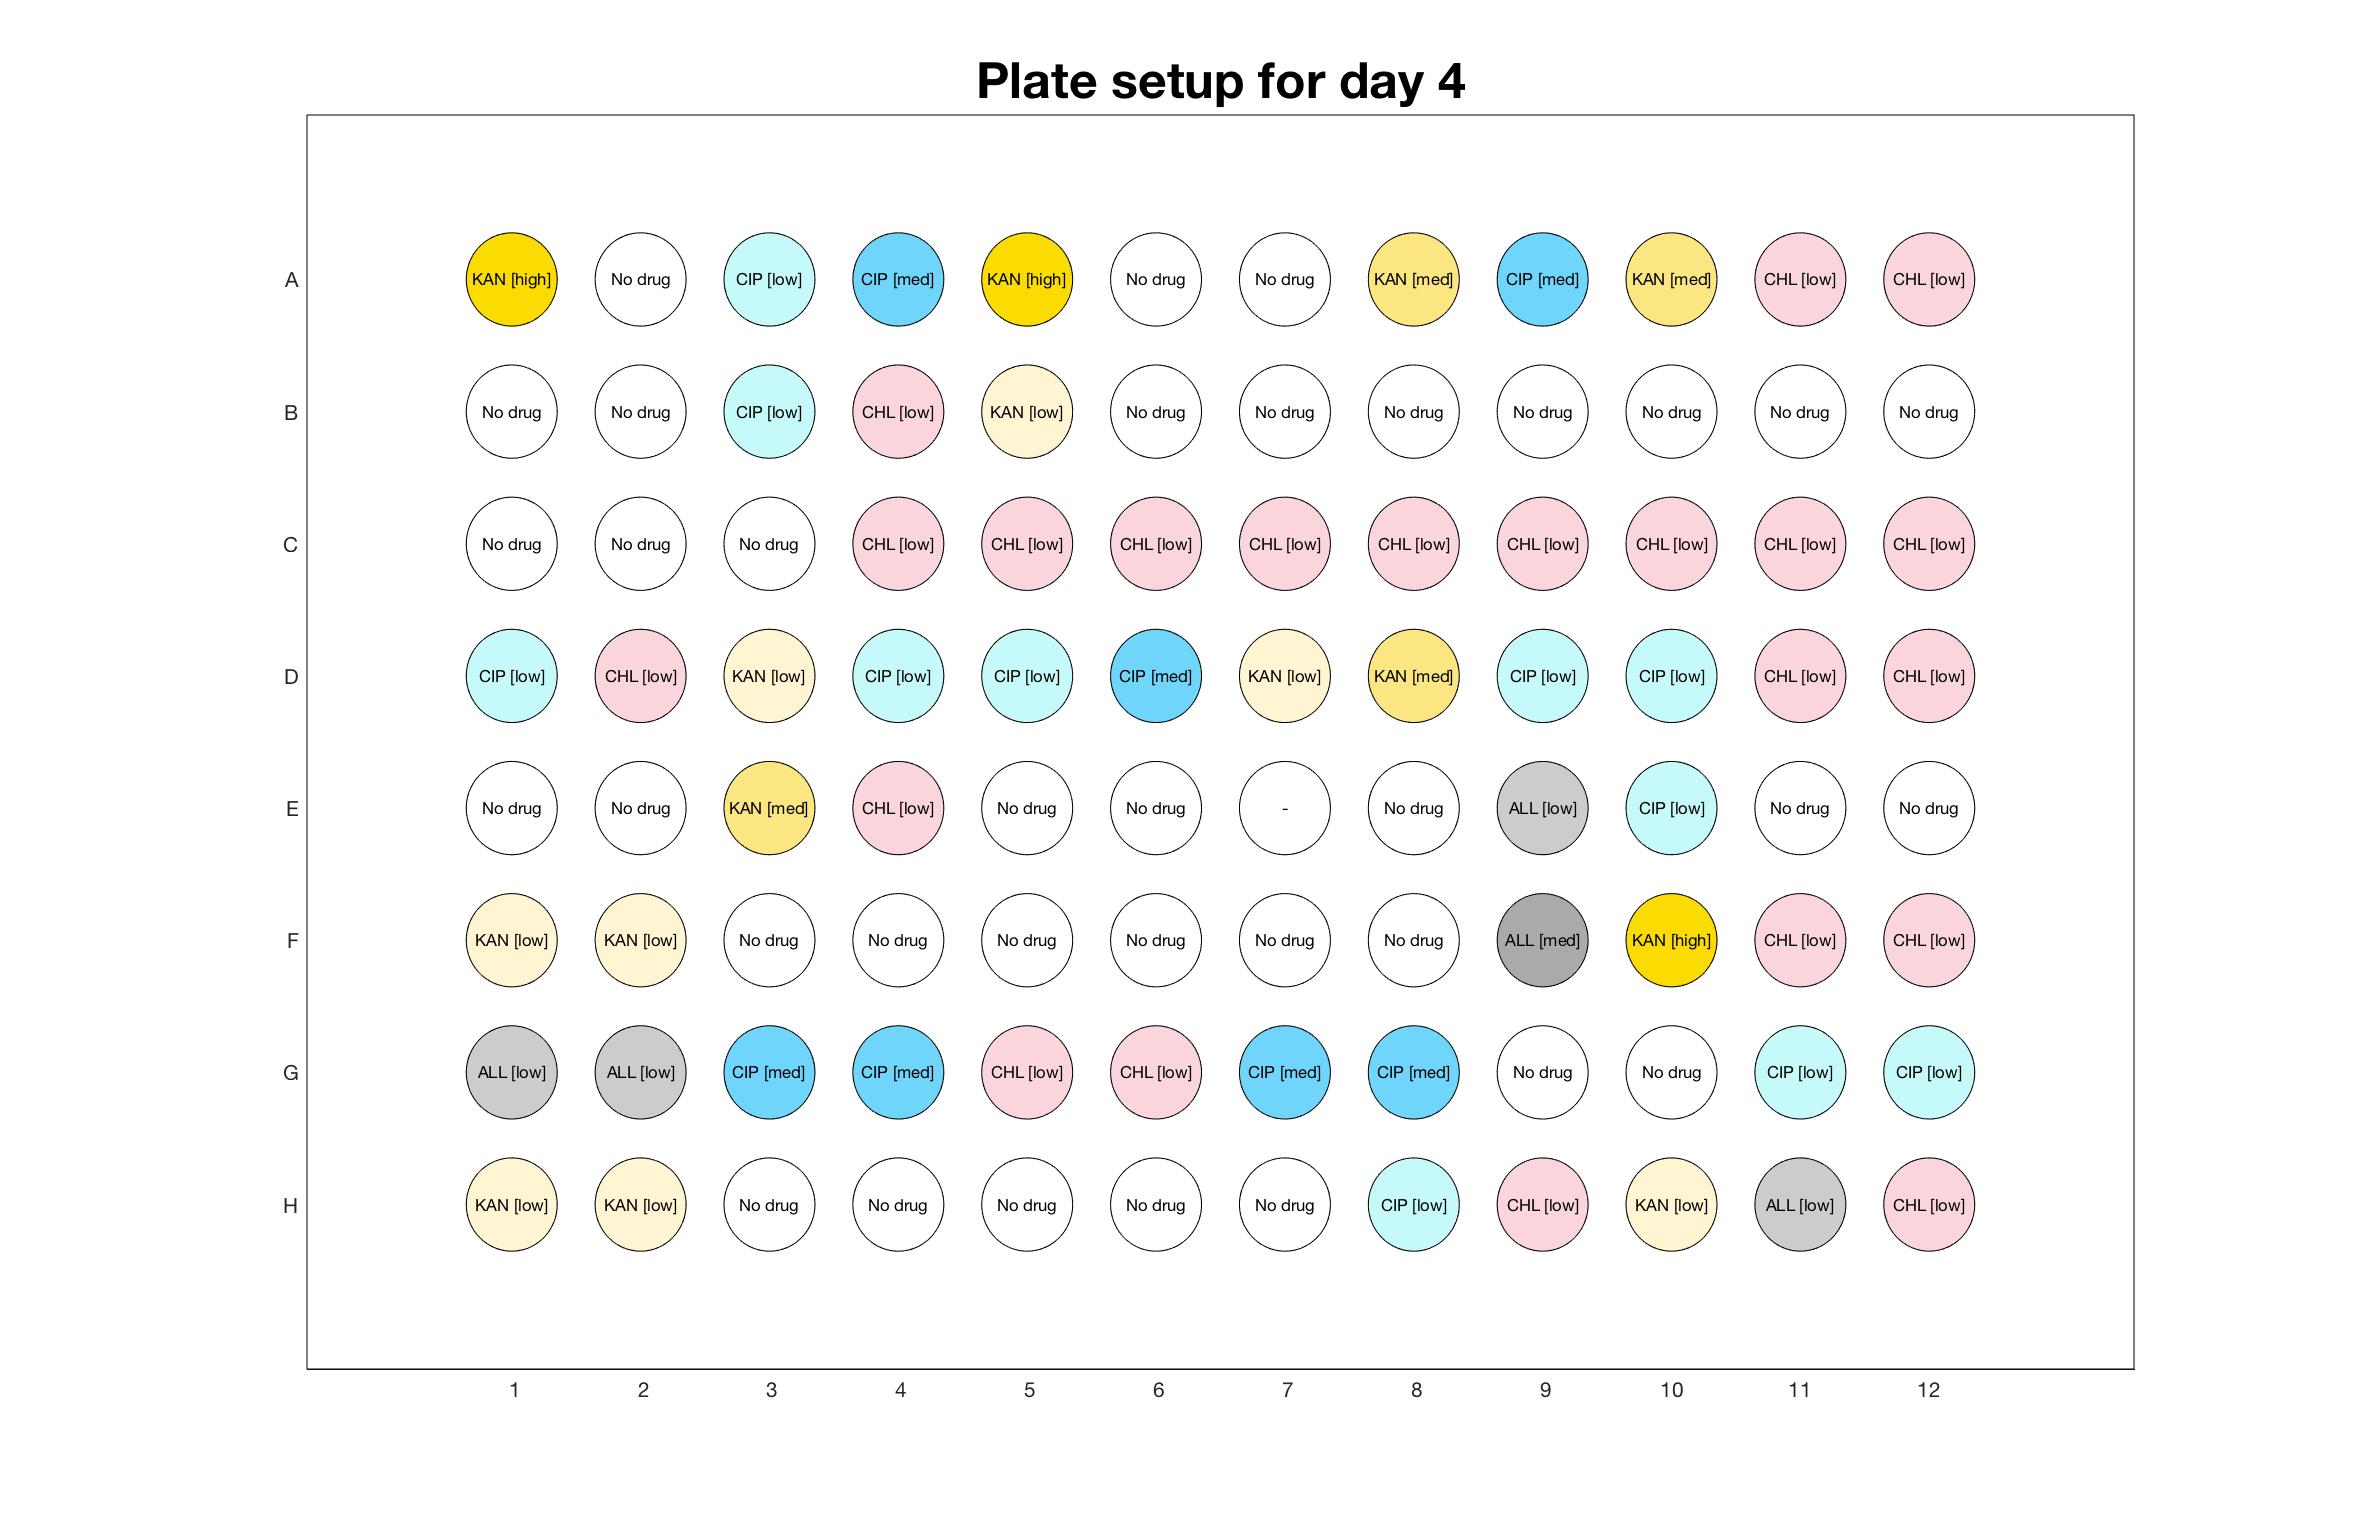
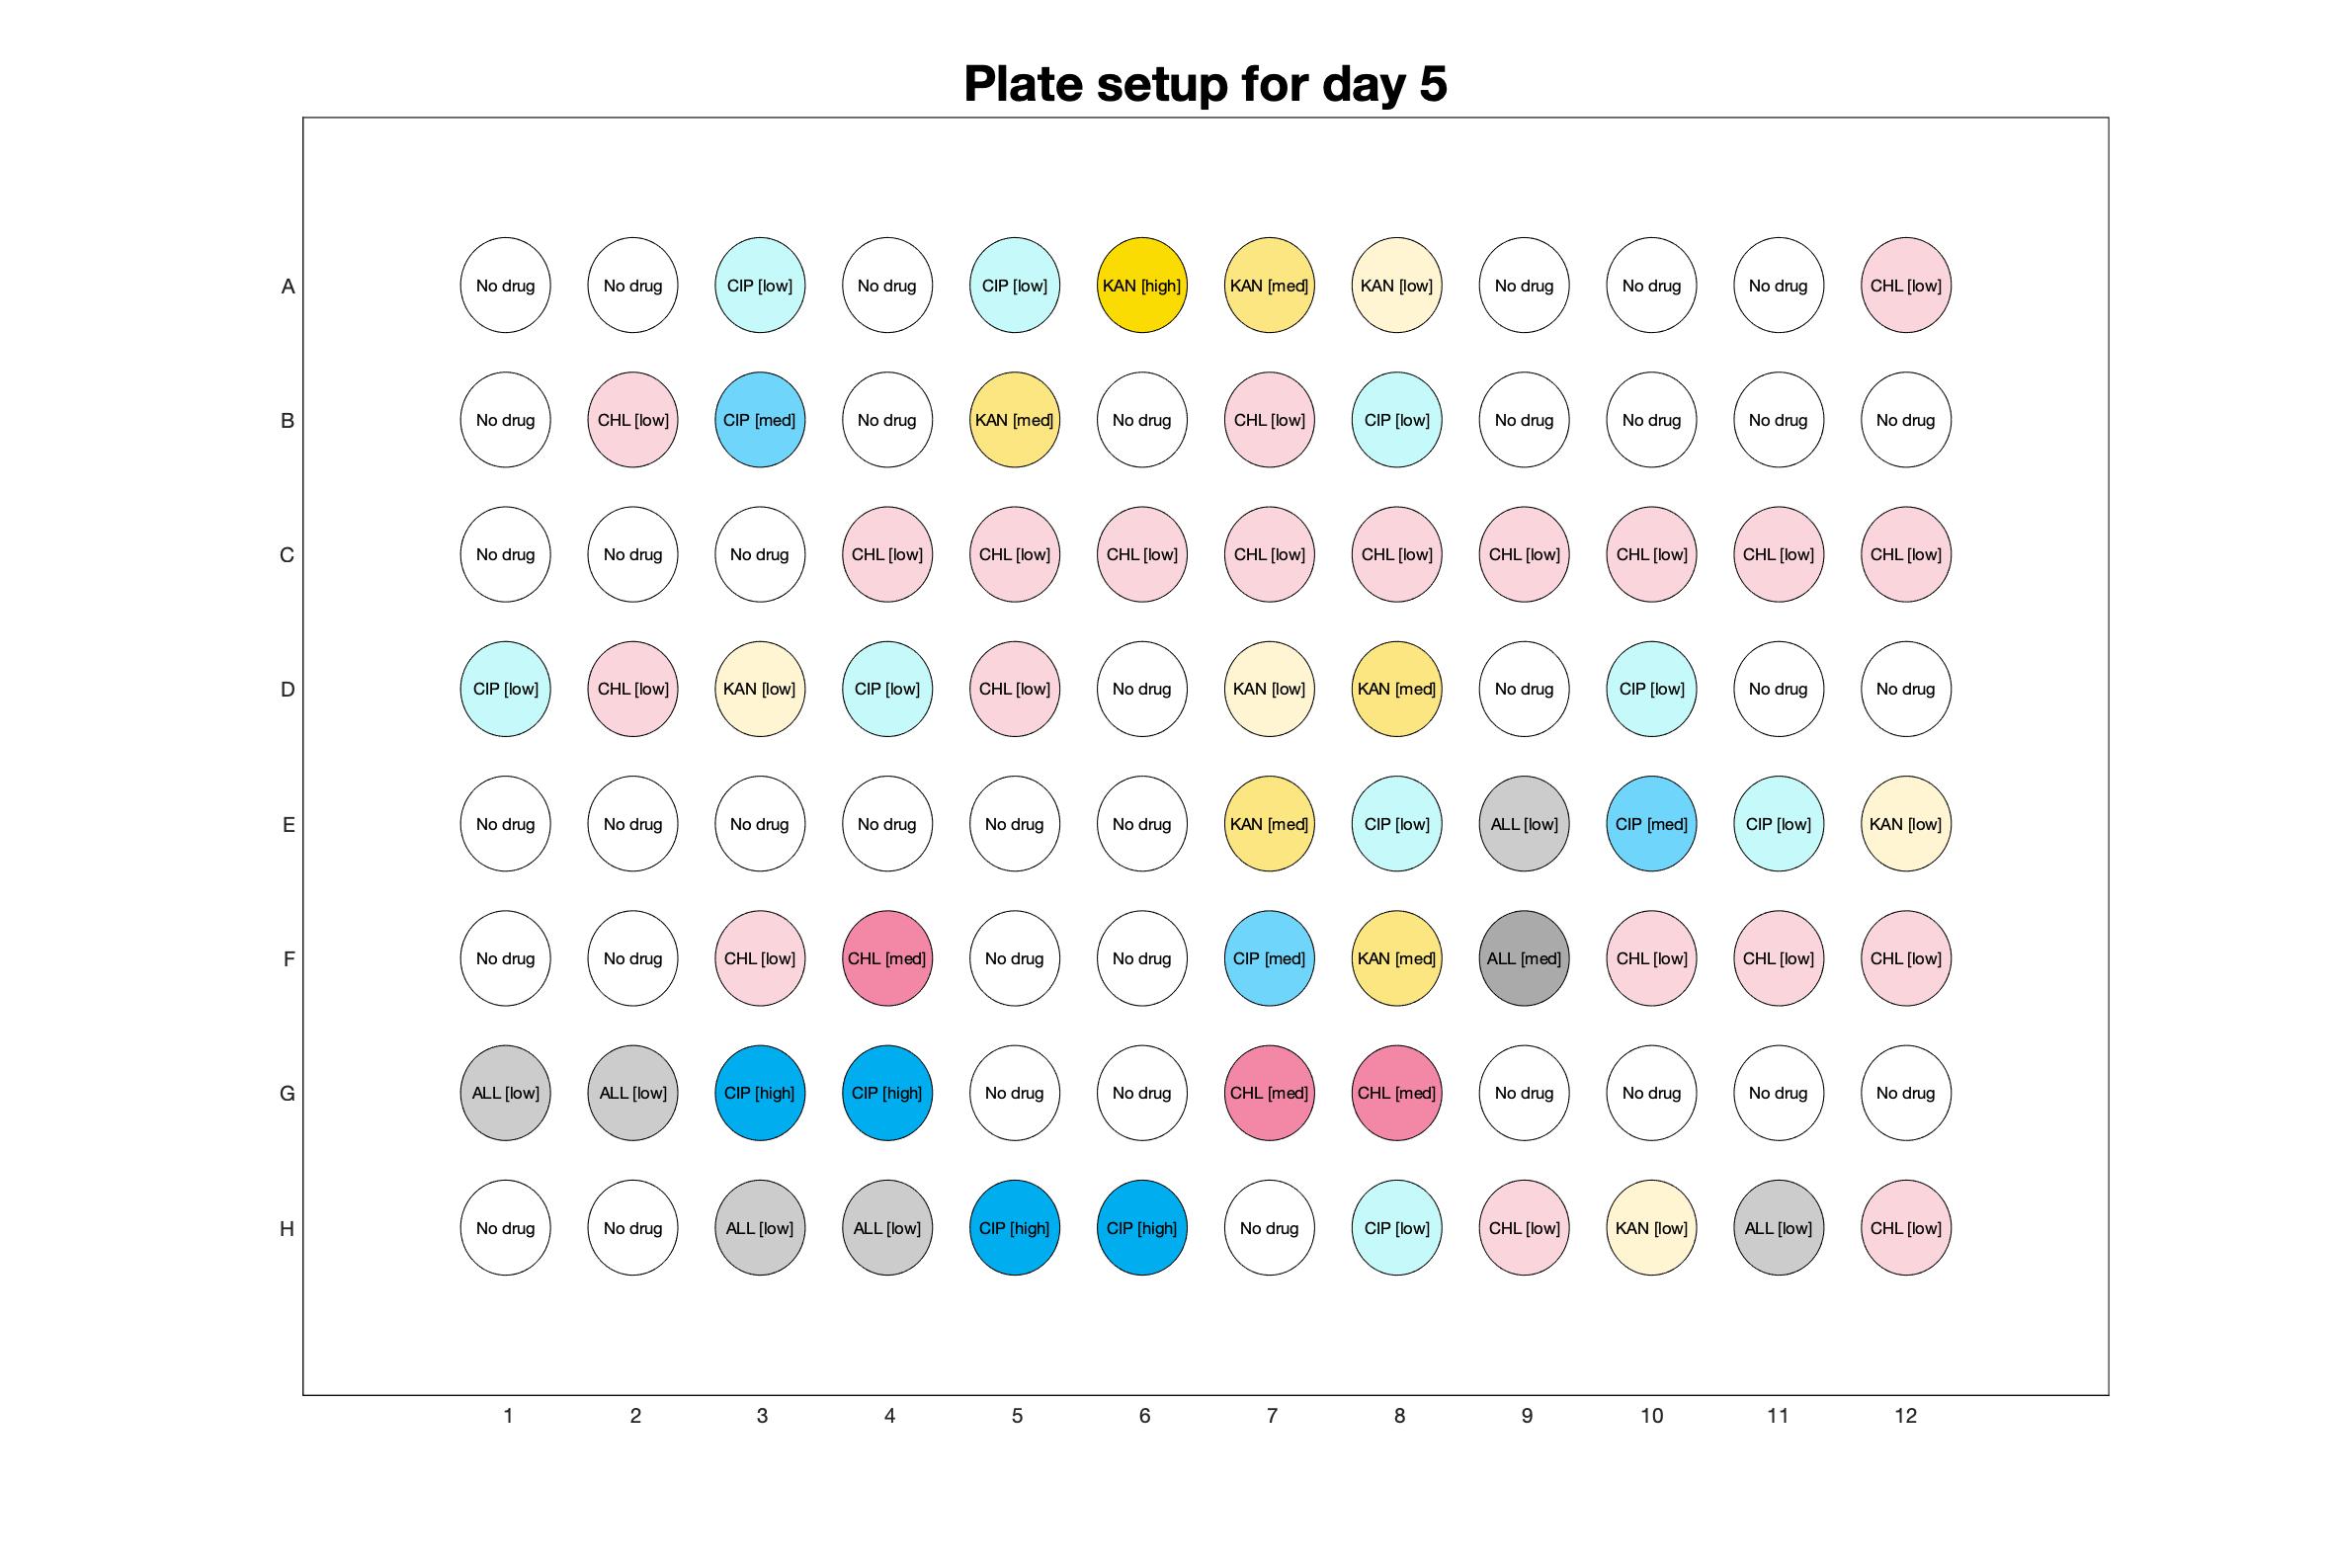
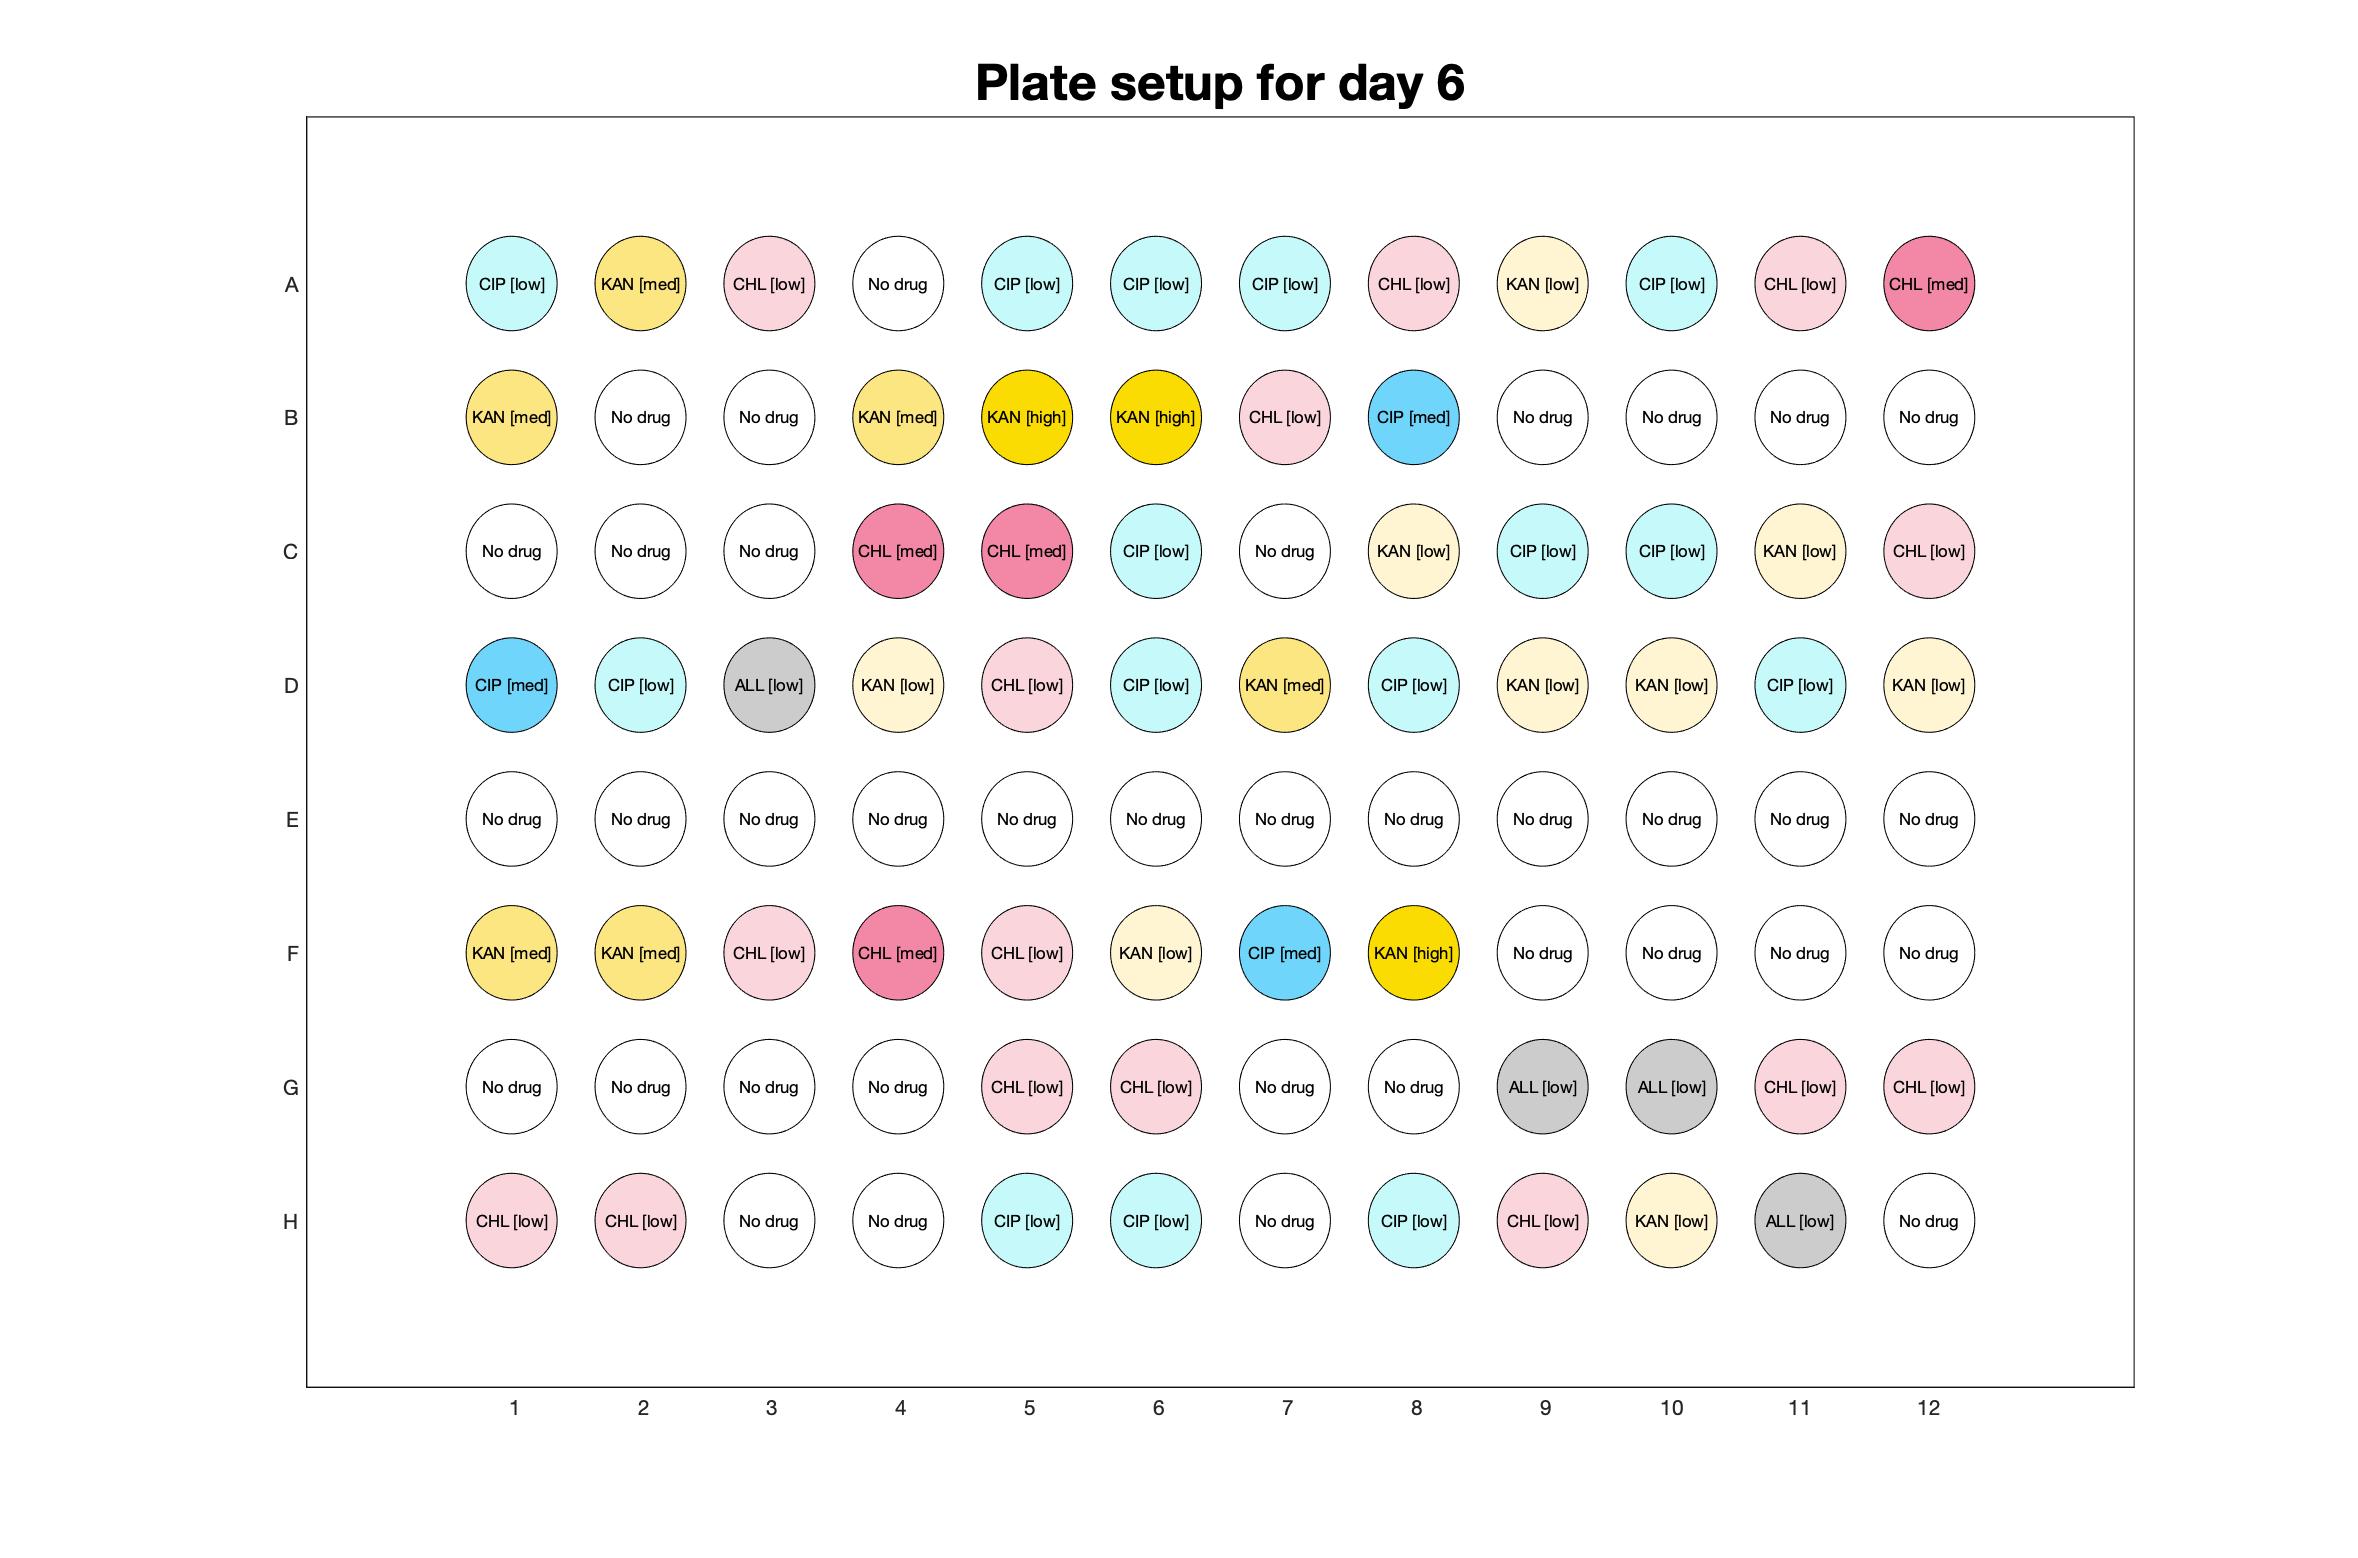
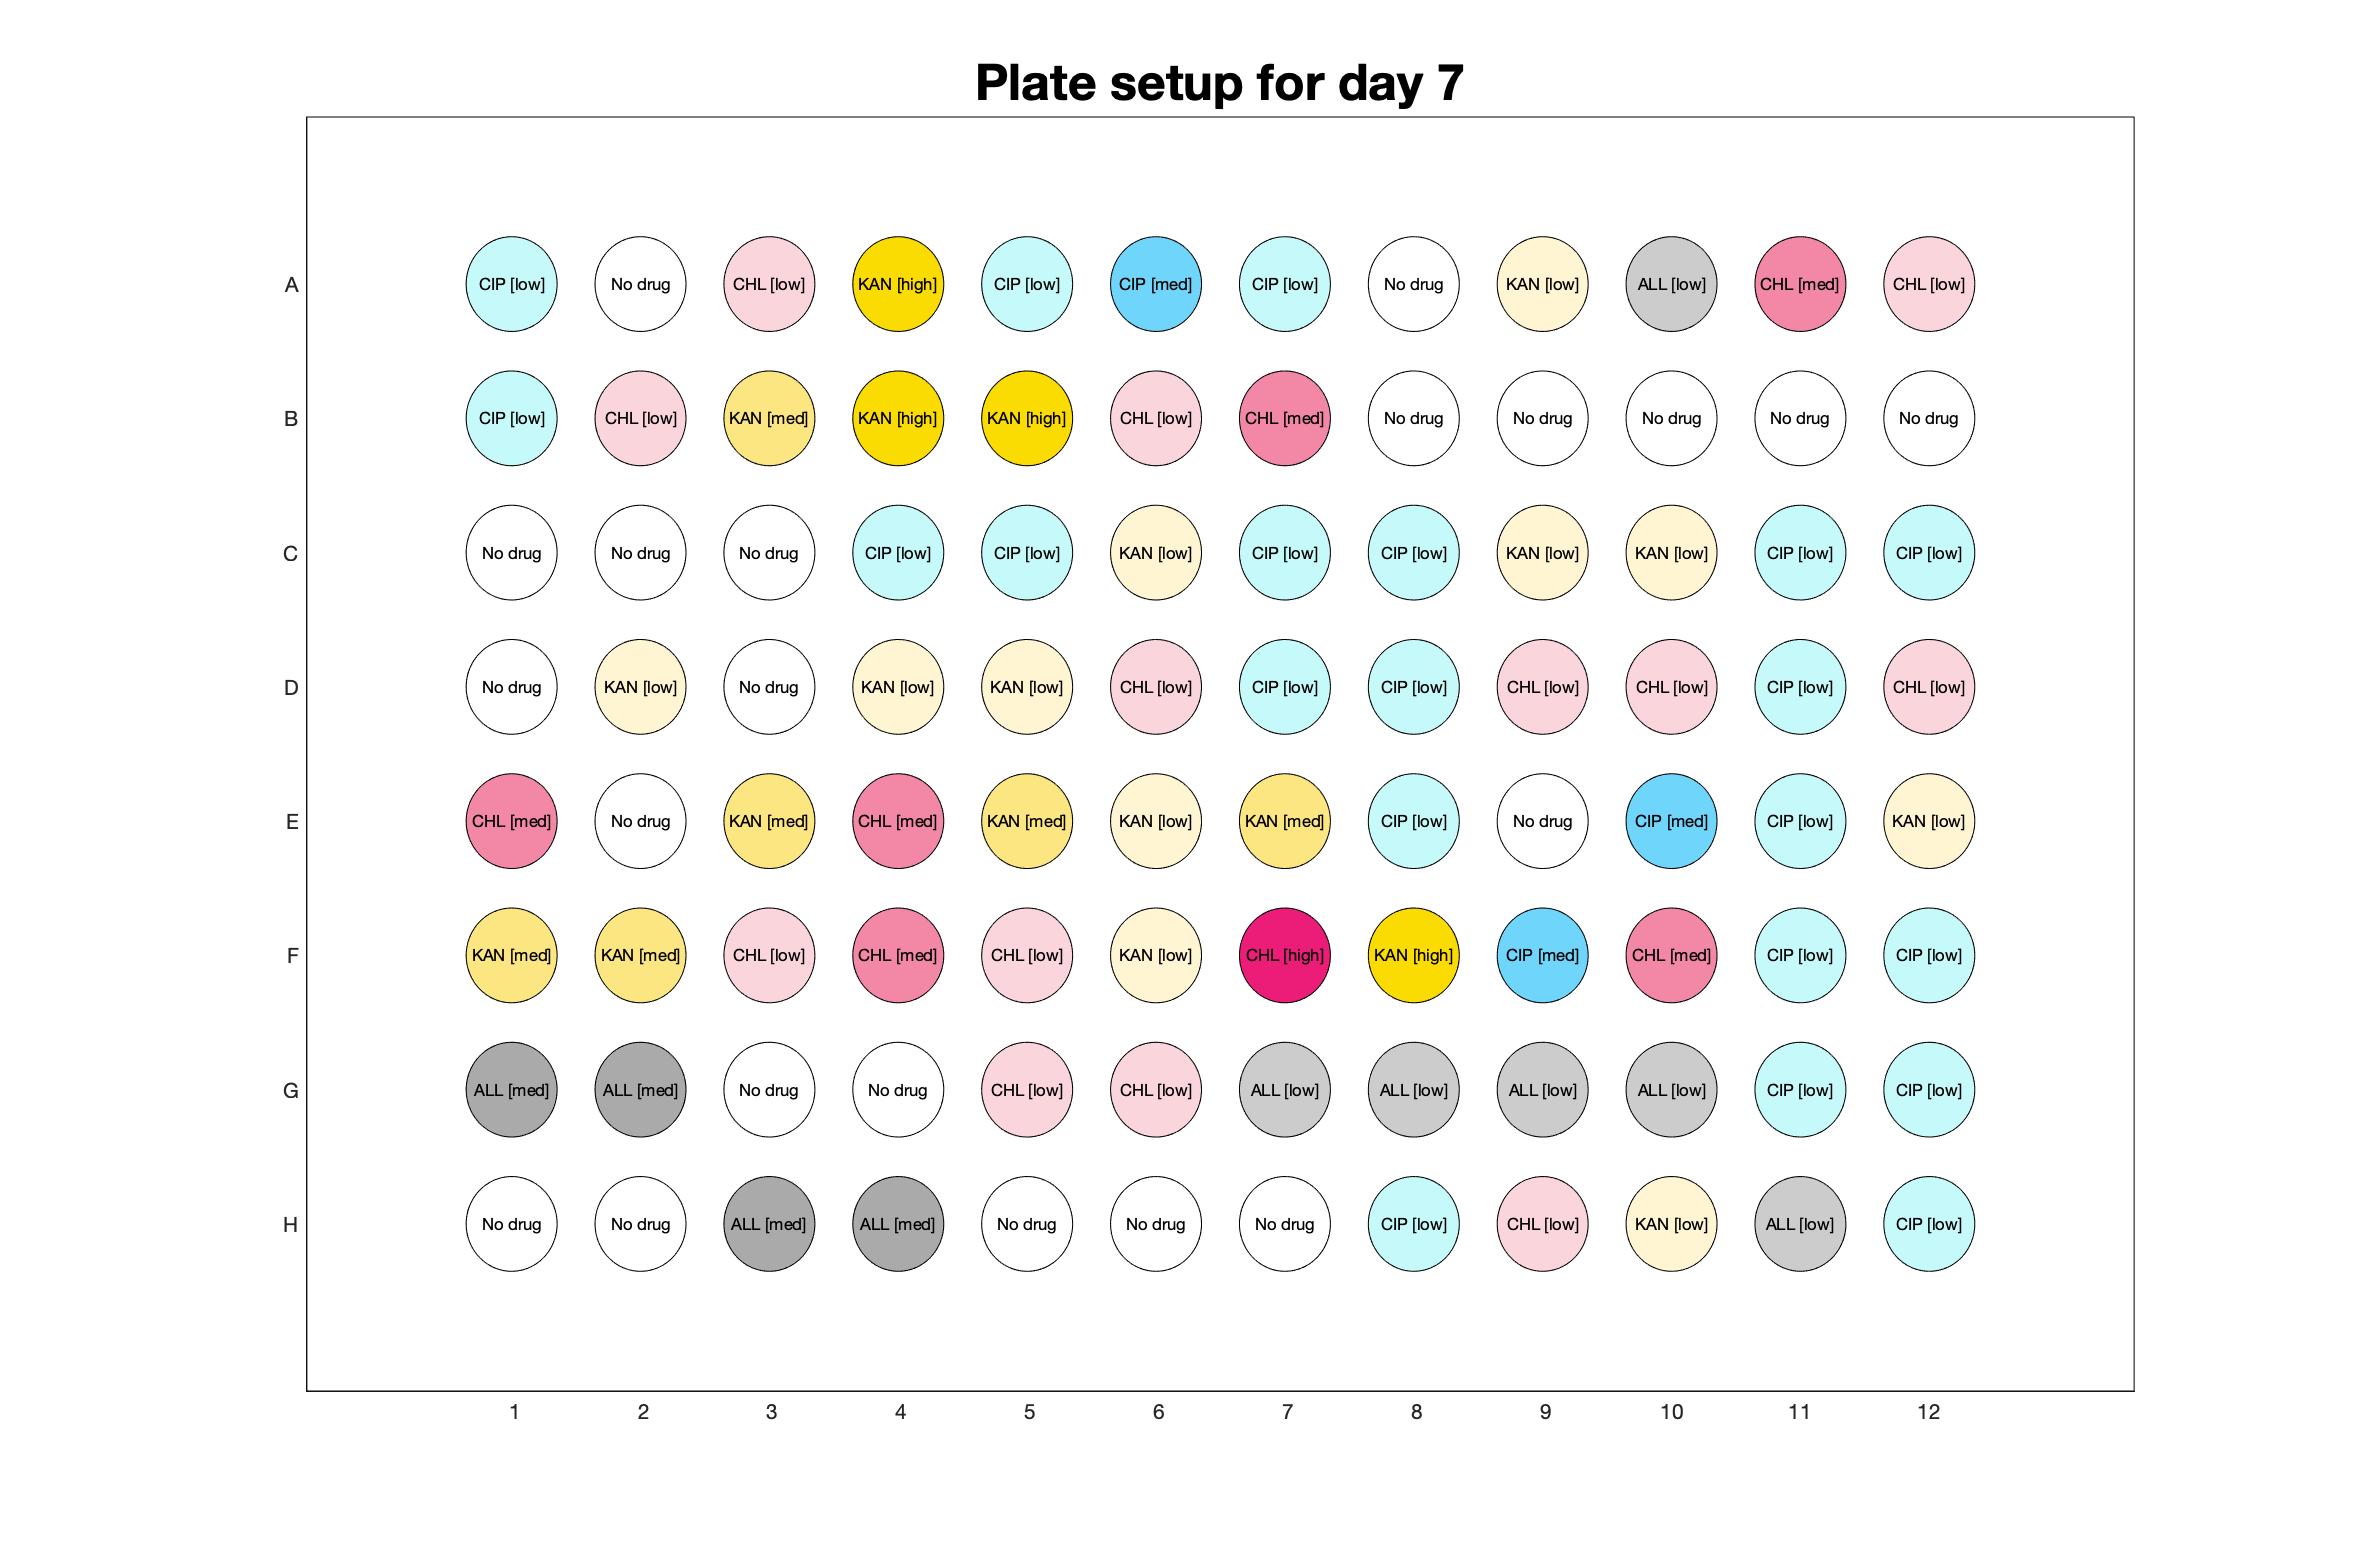
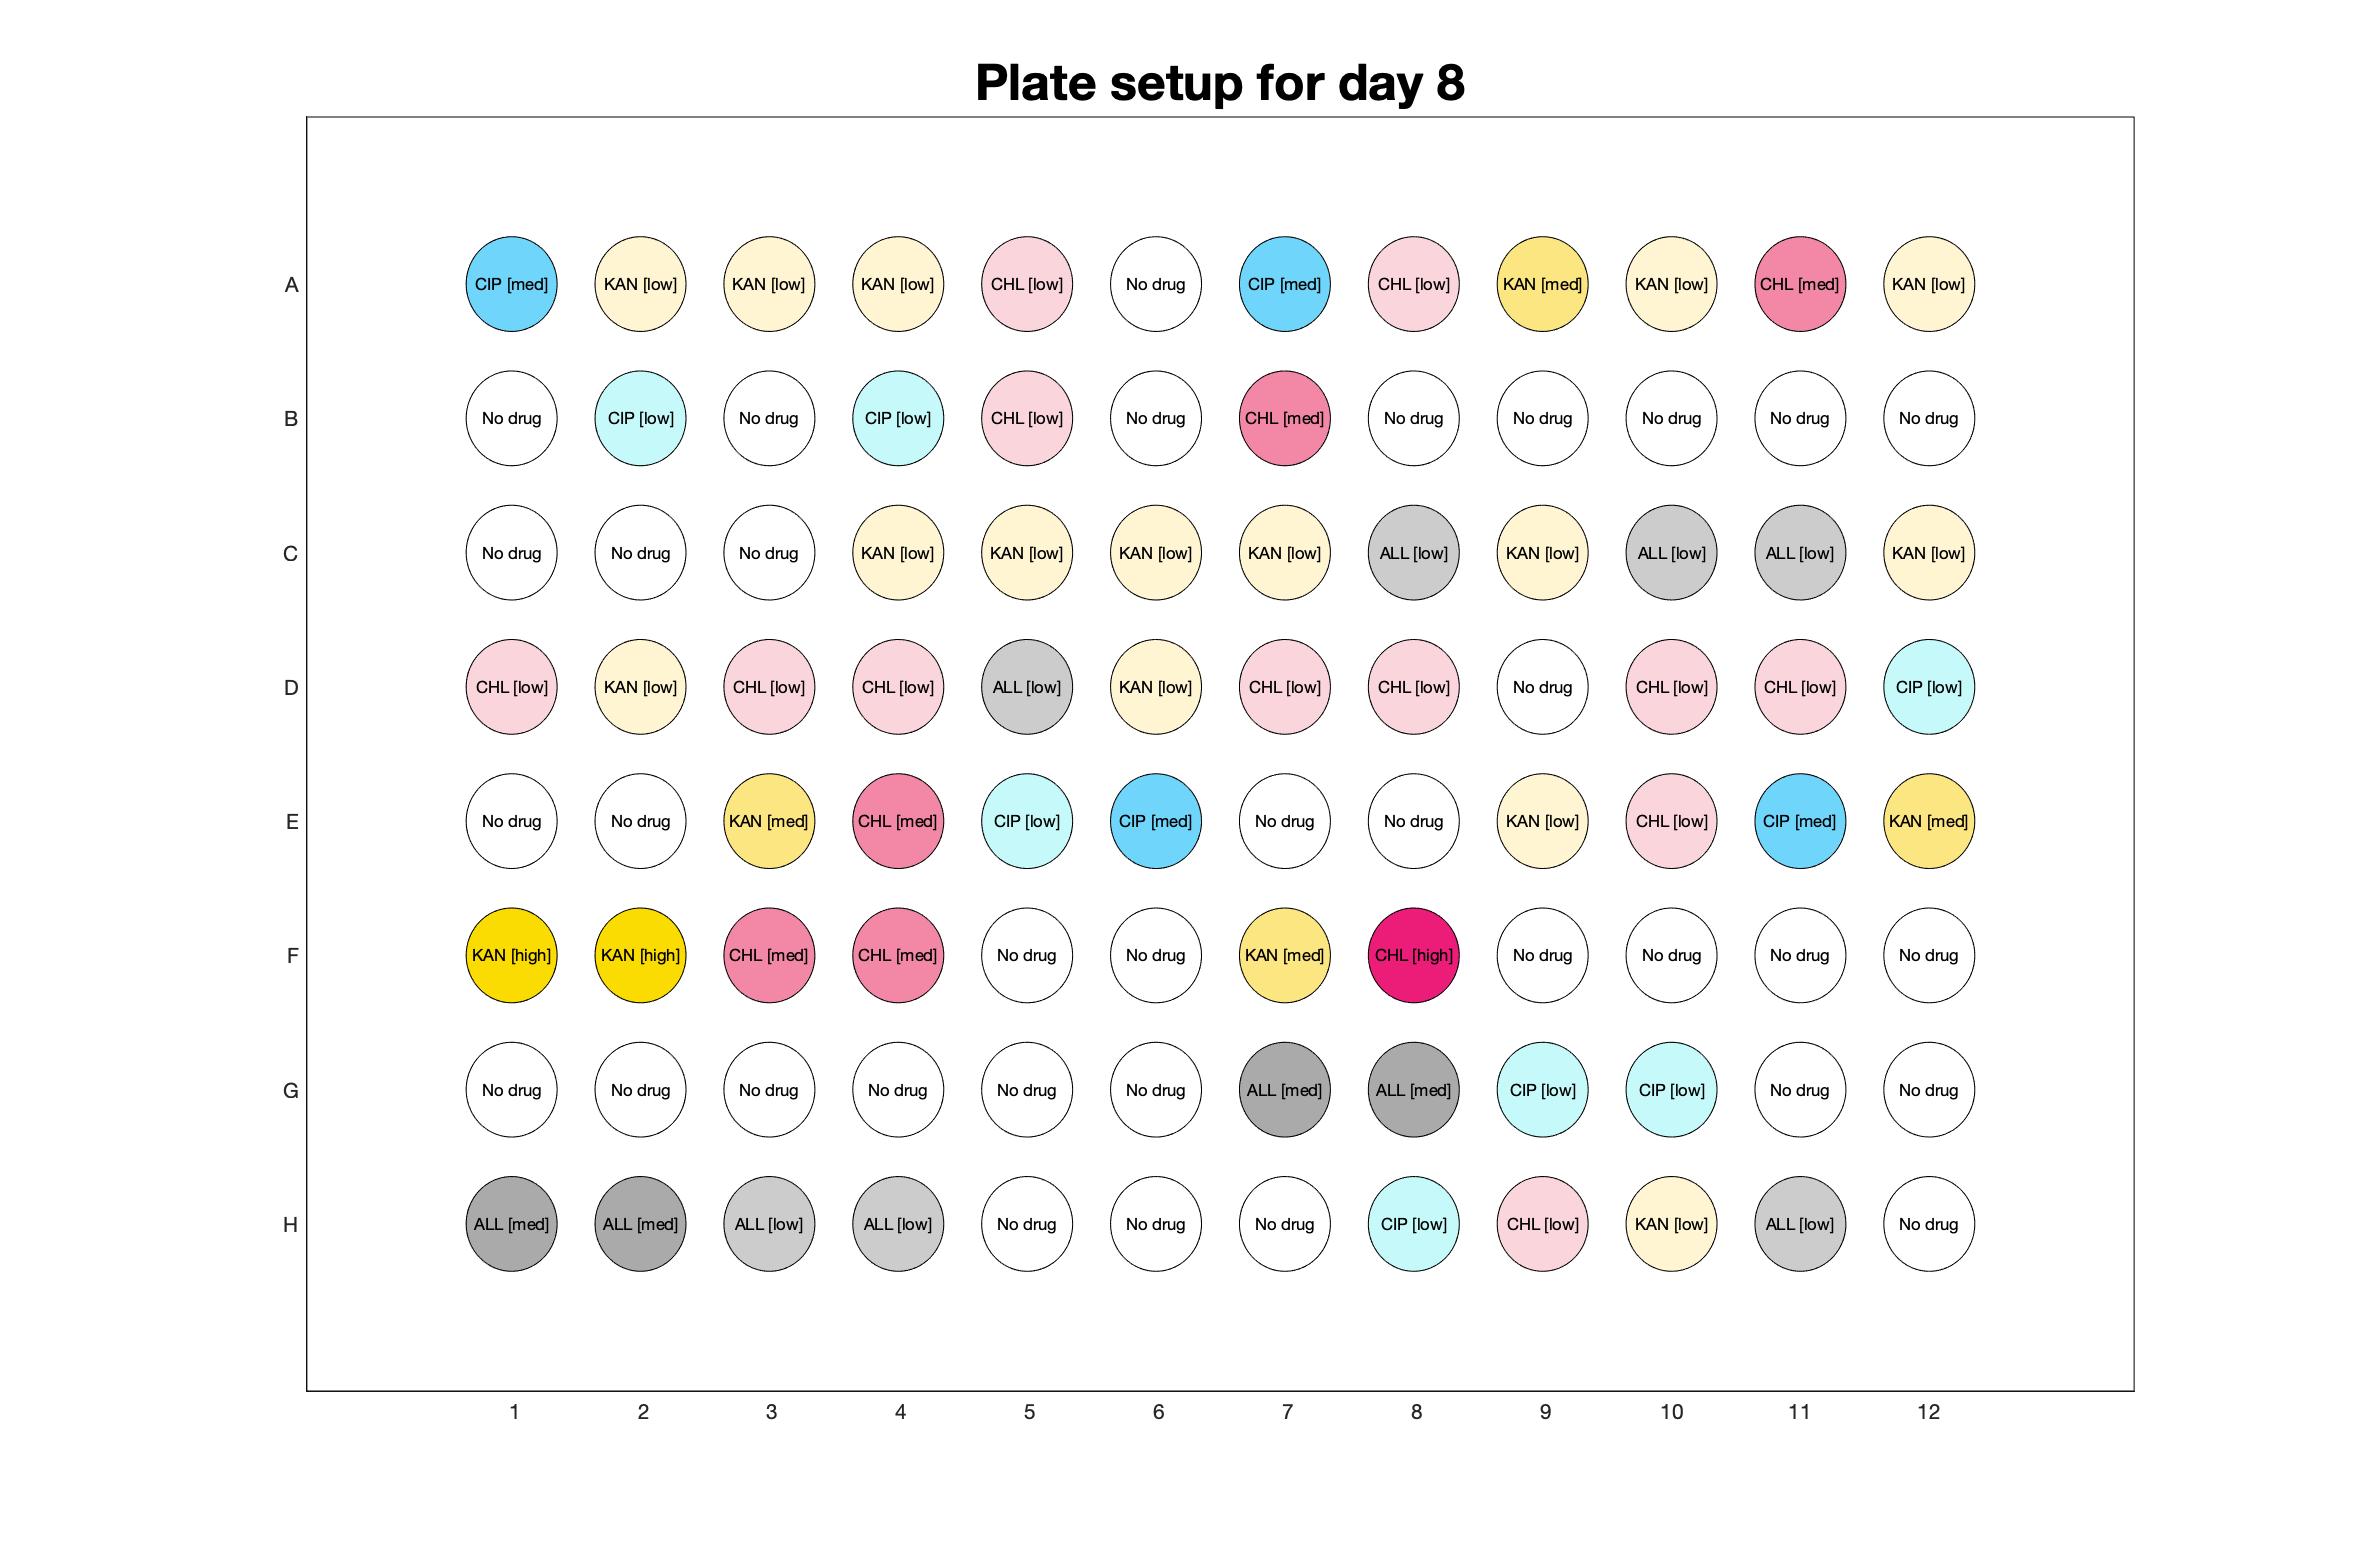
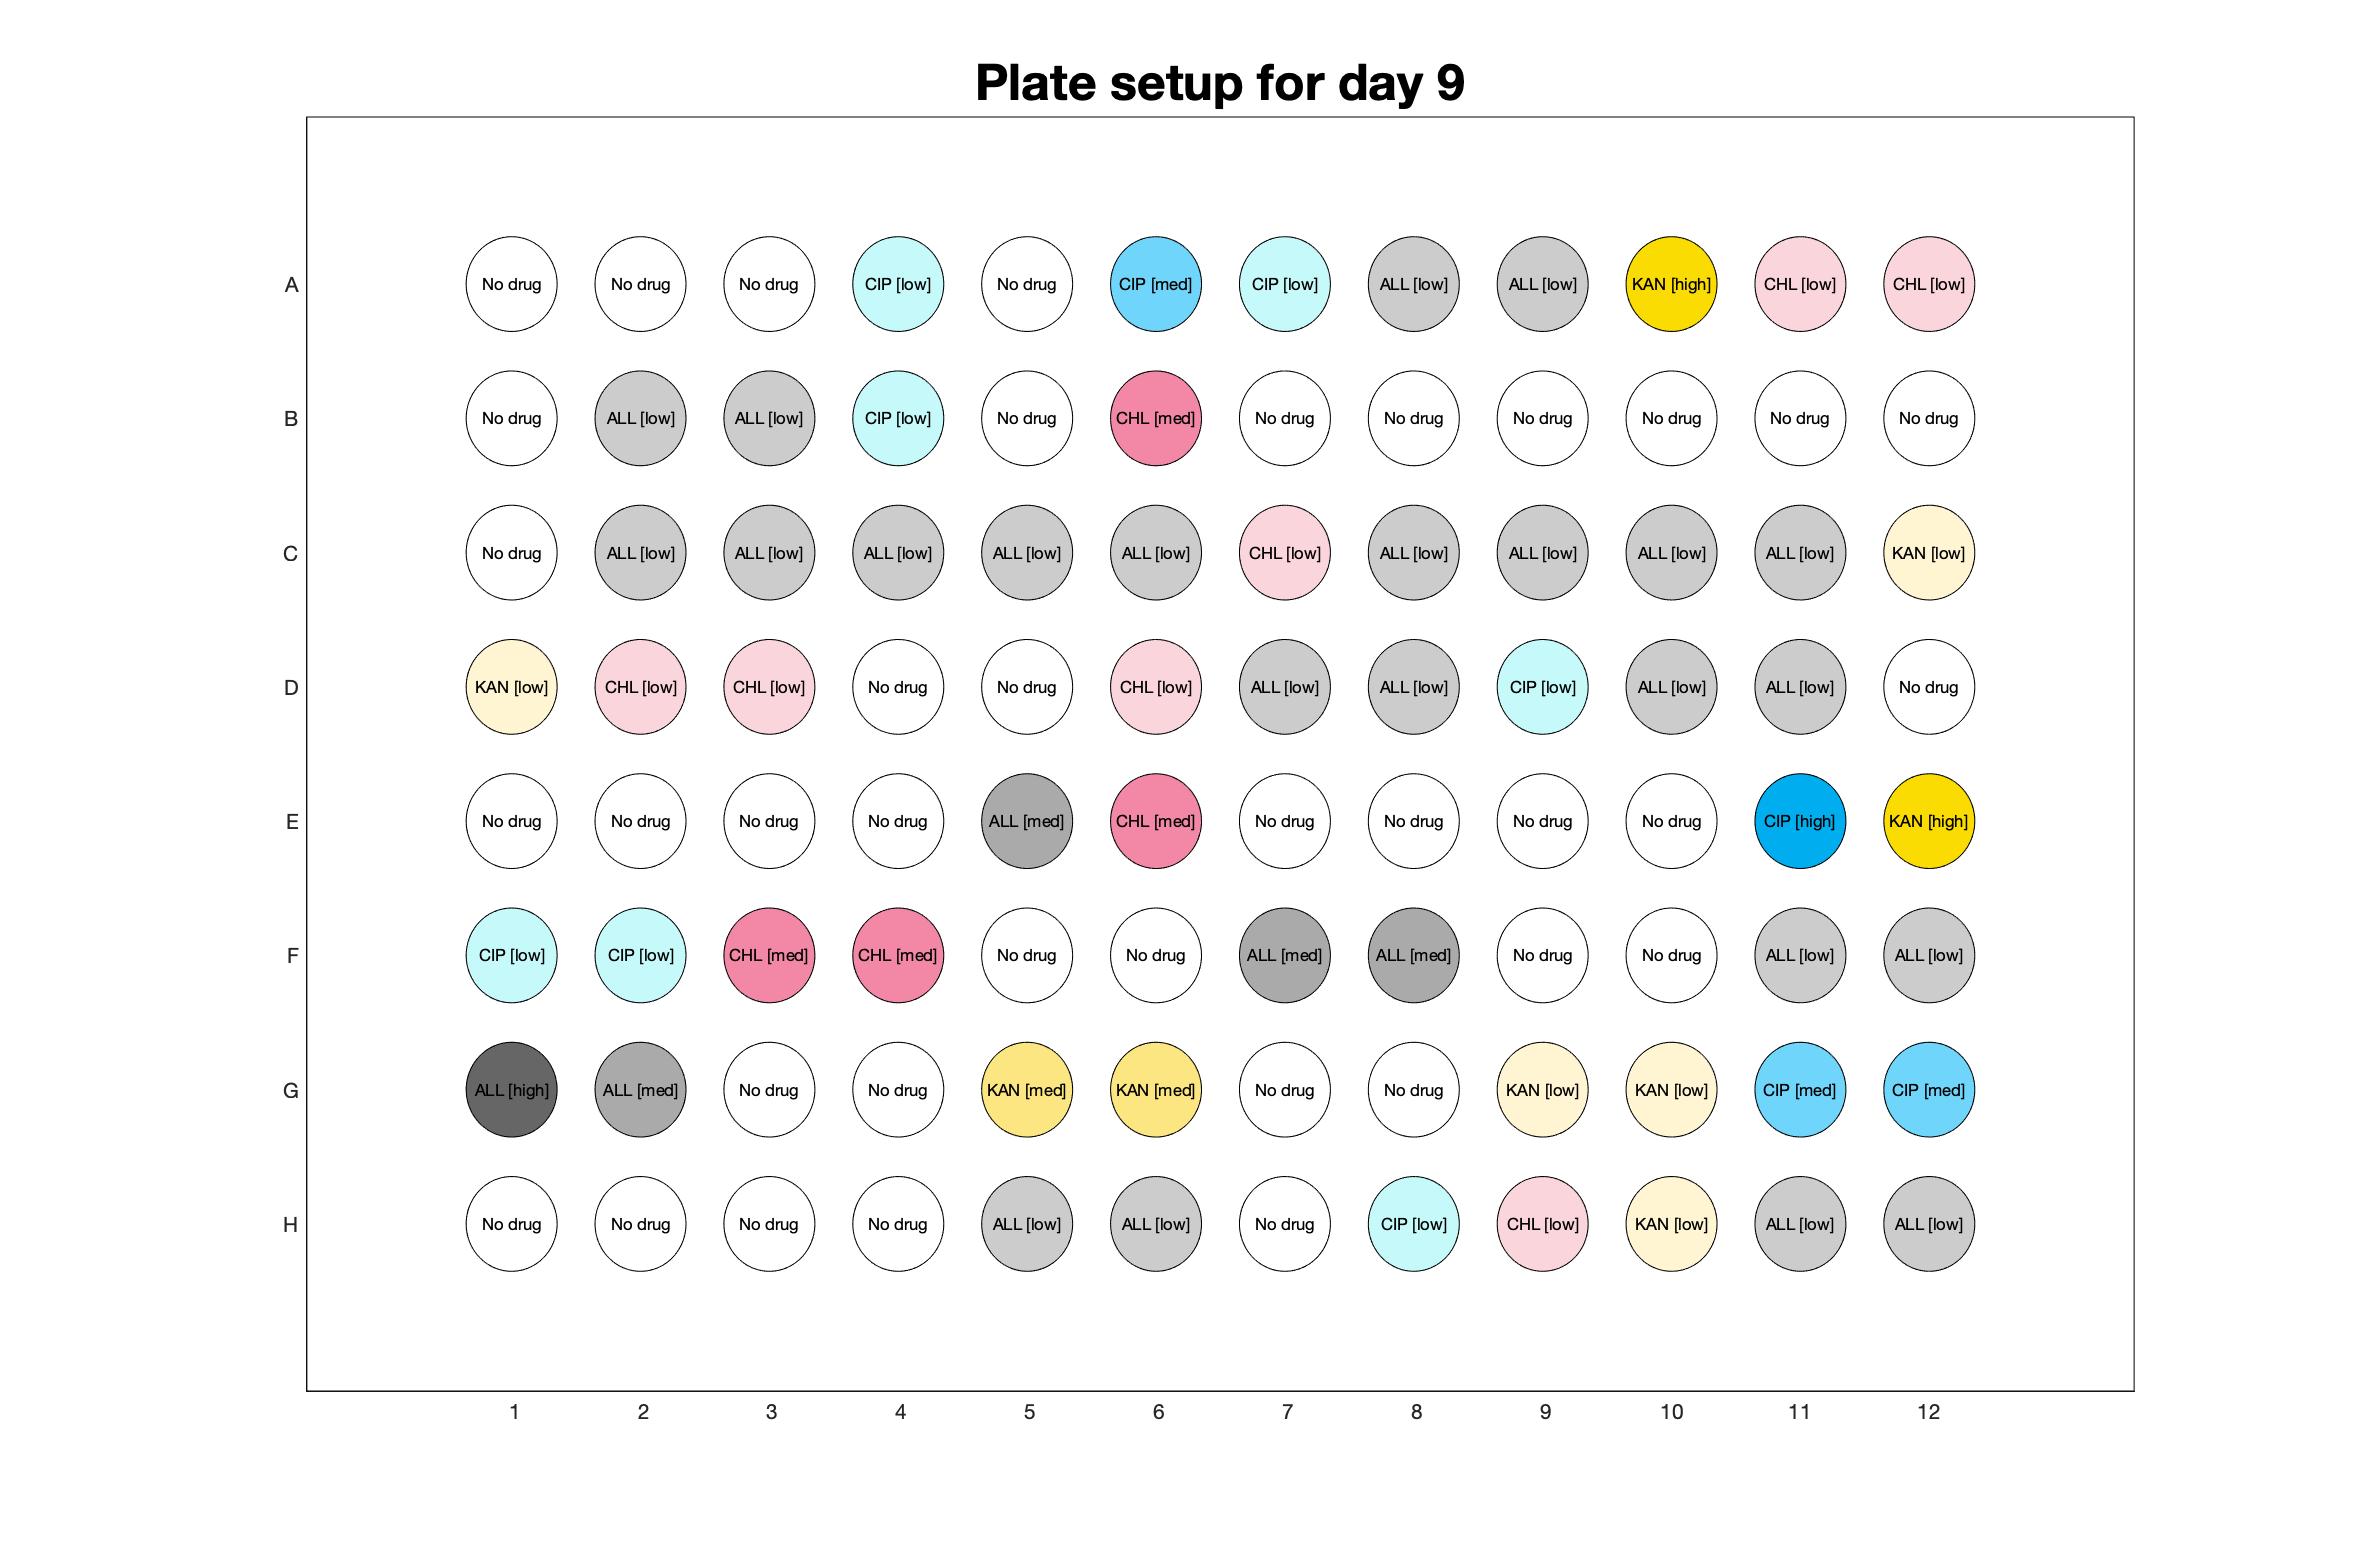
Daily drug regimen
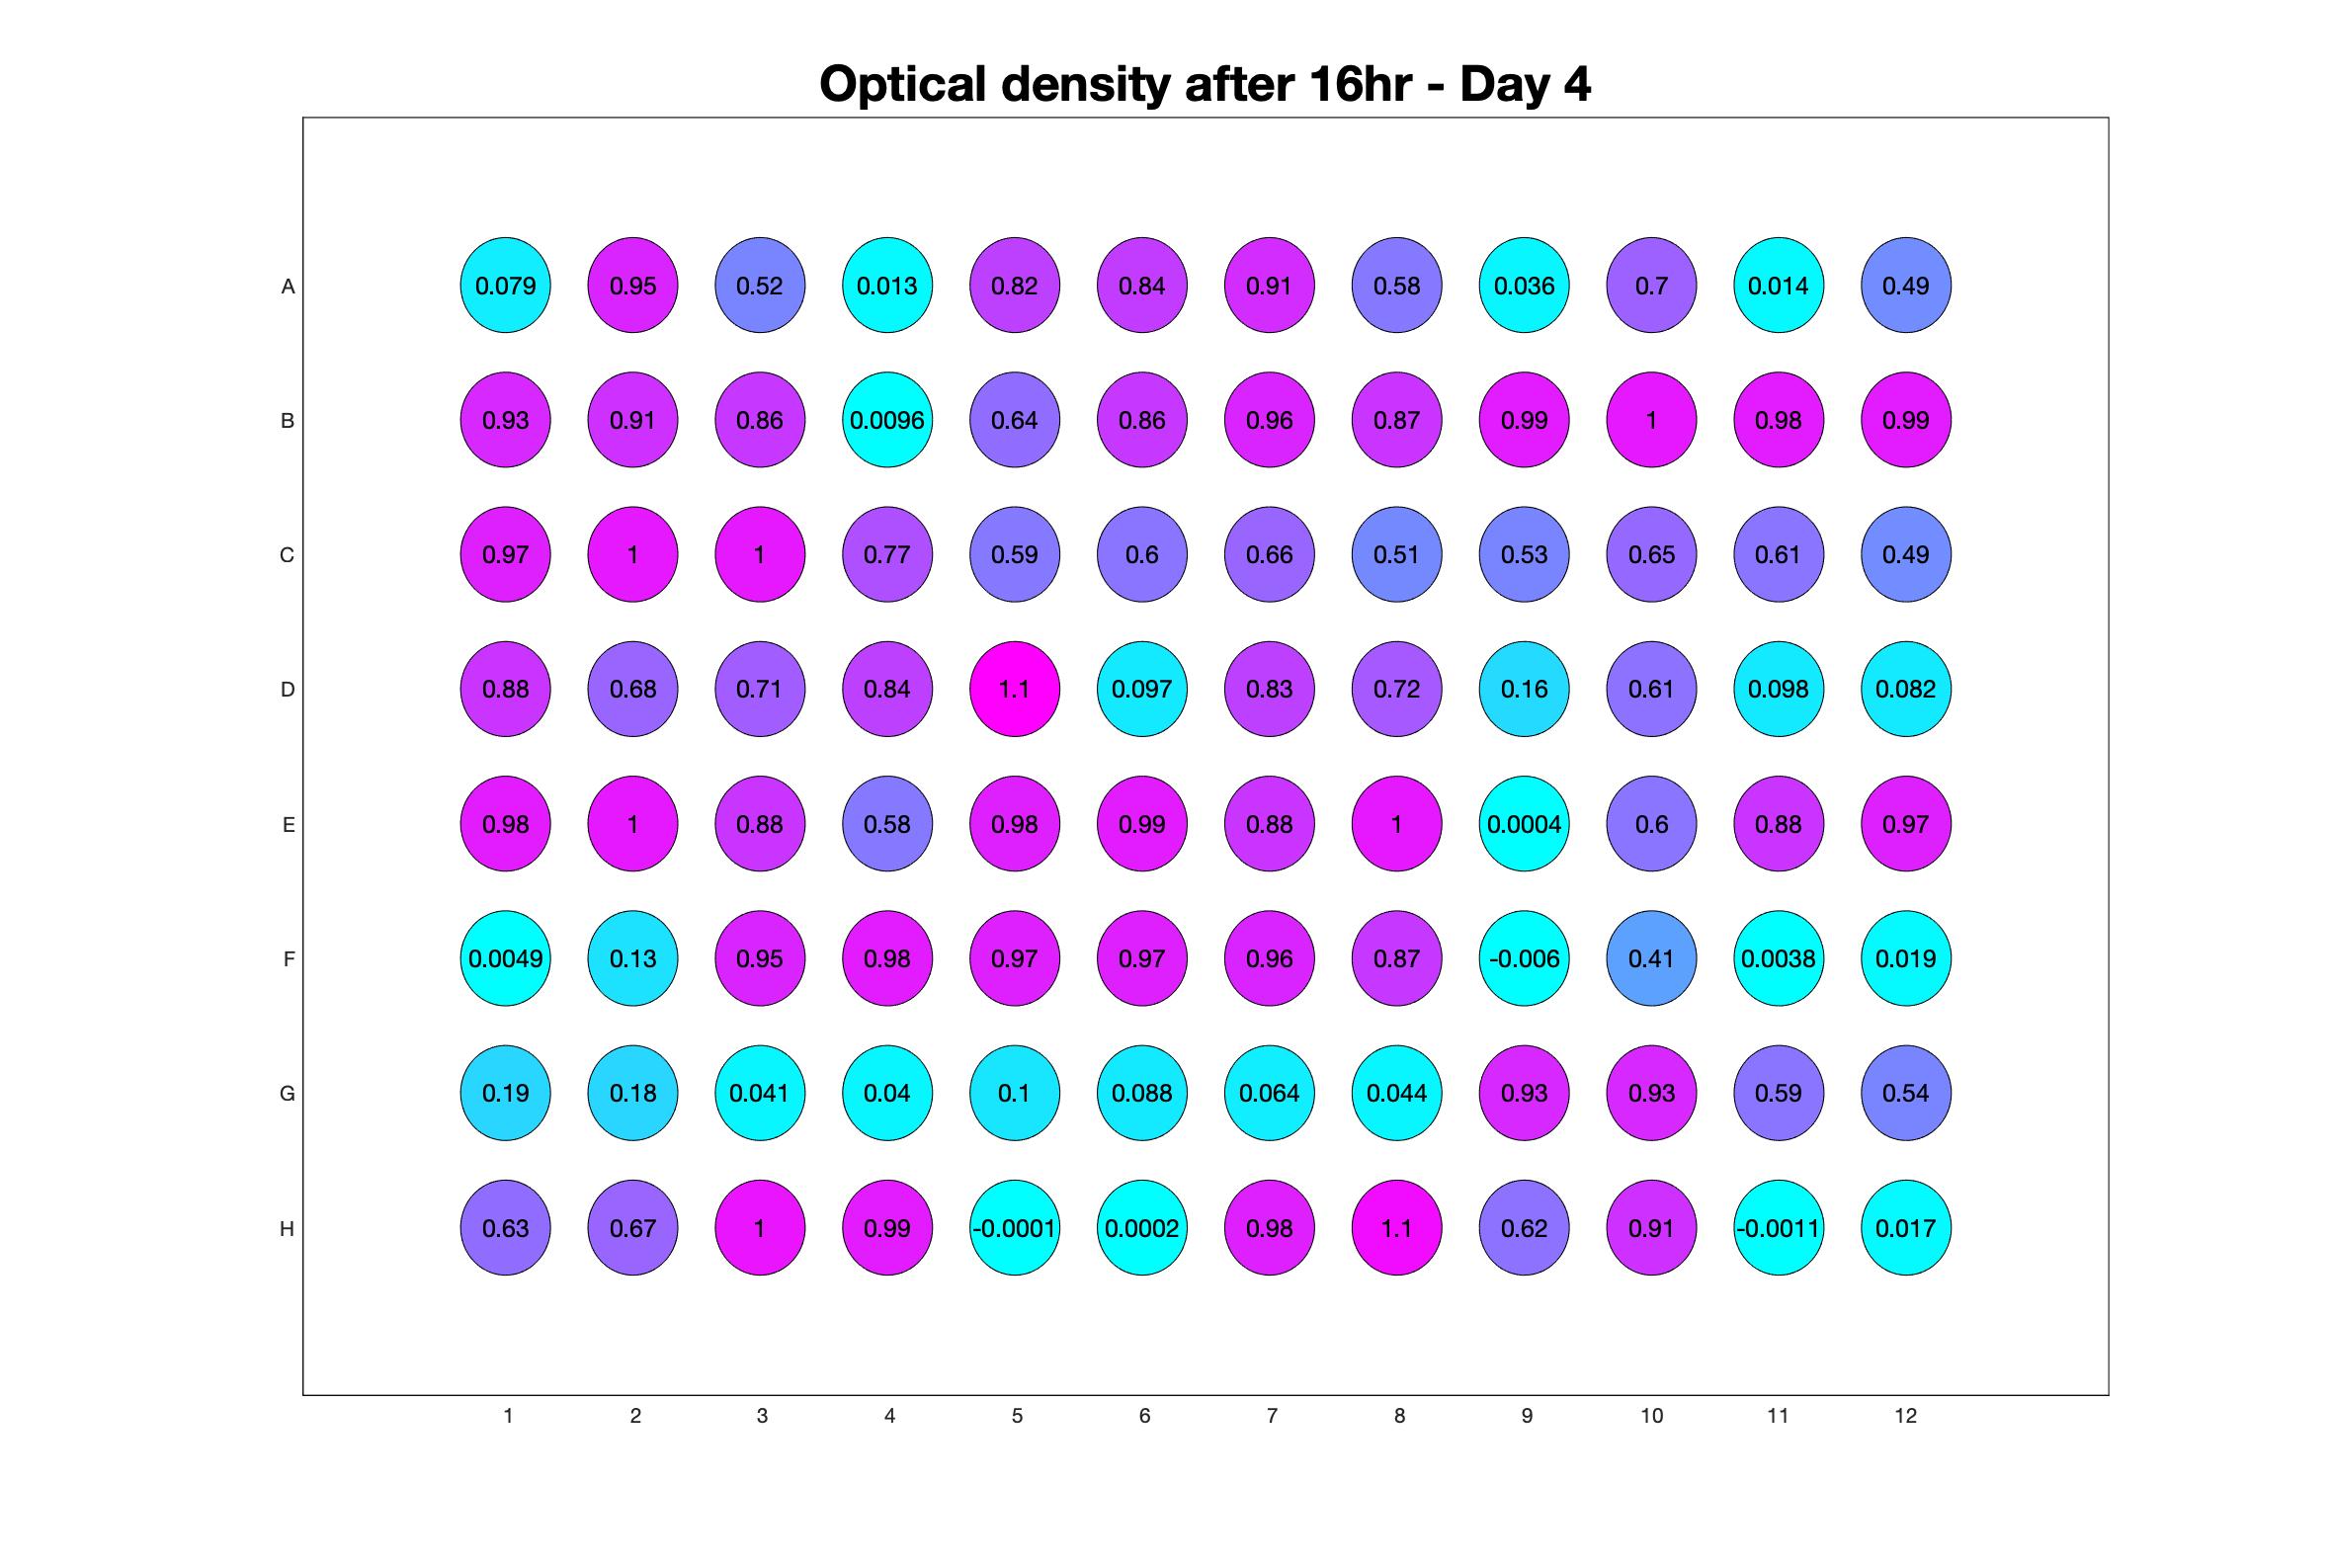
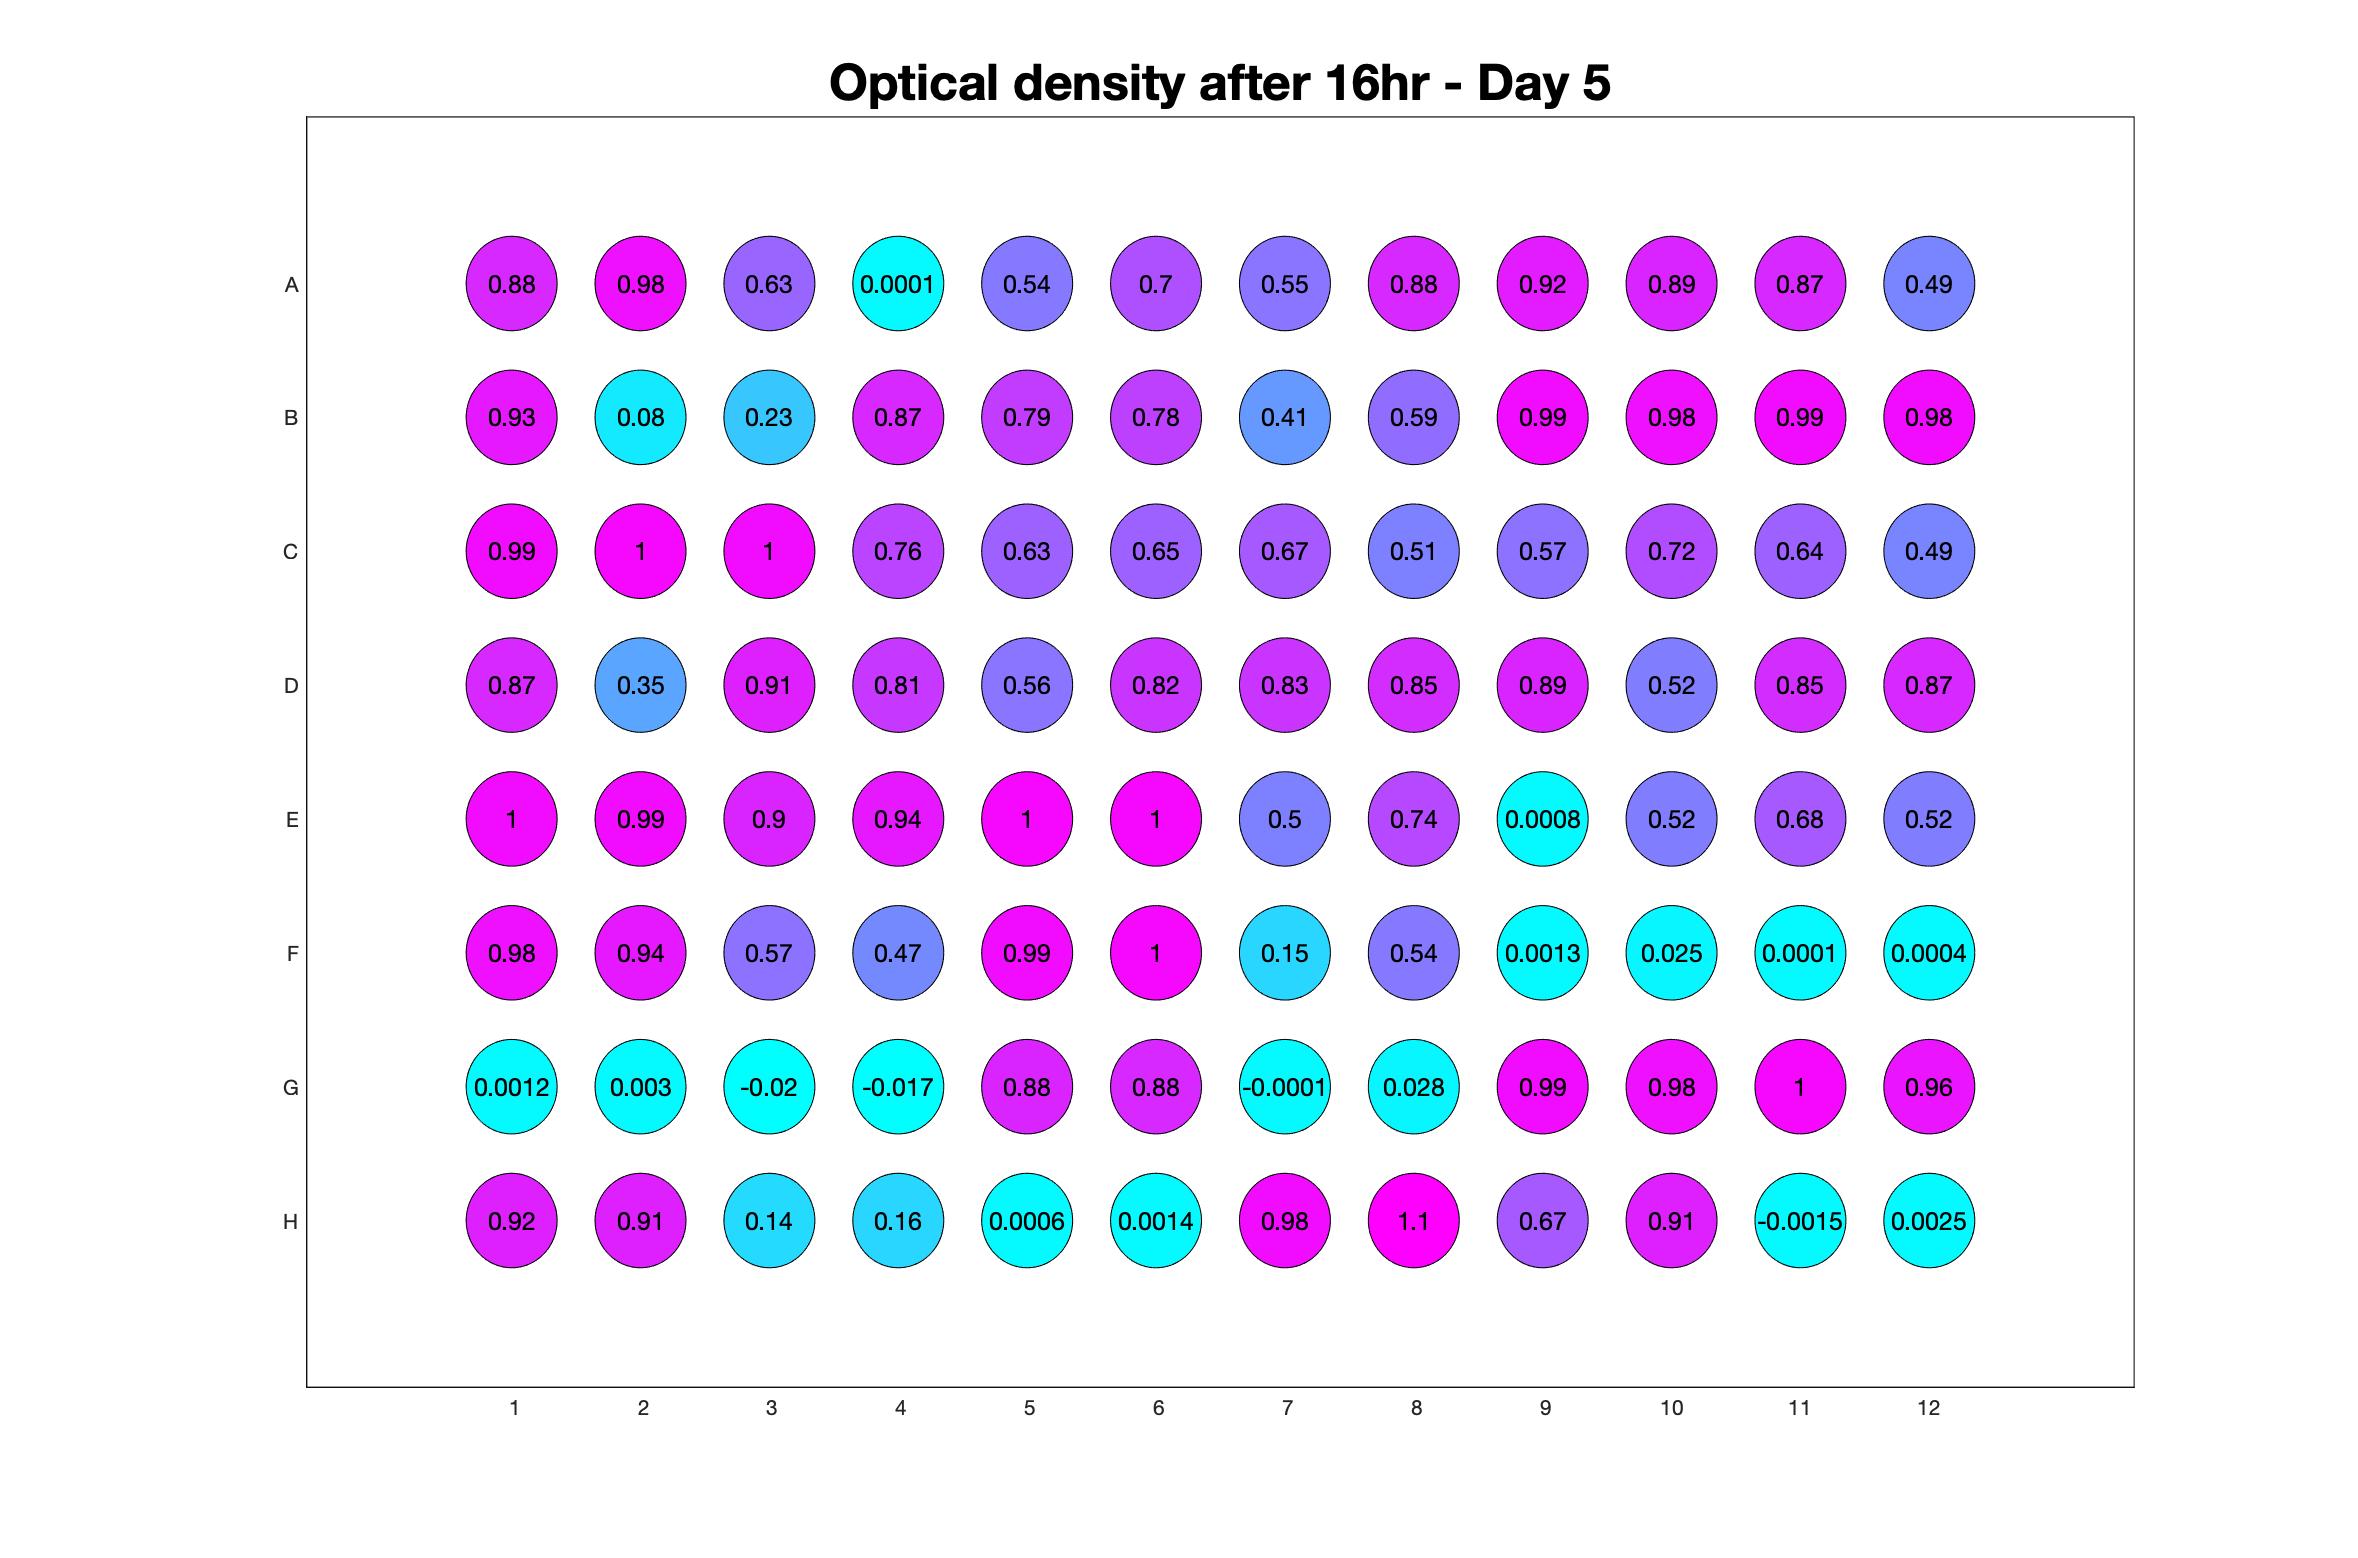
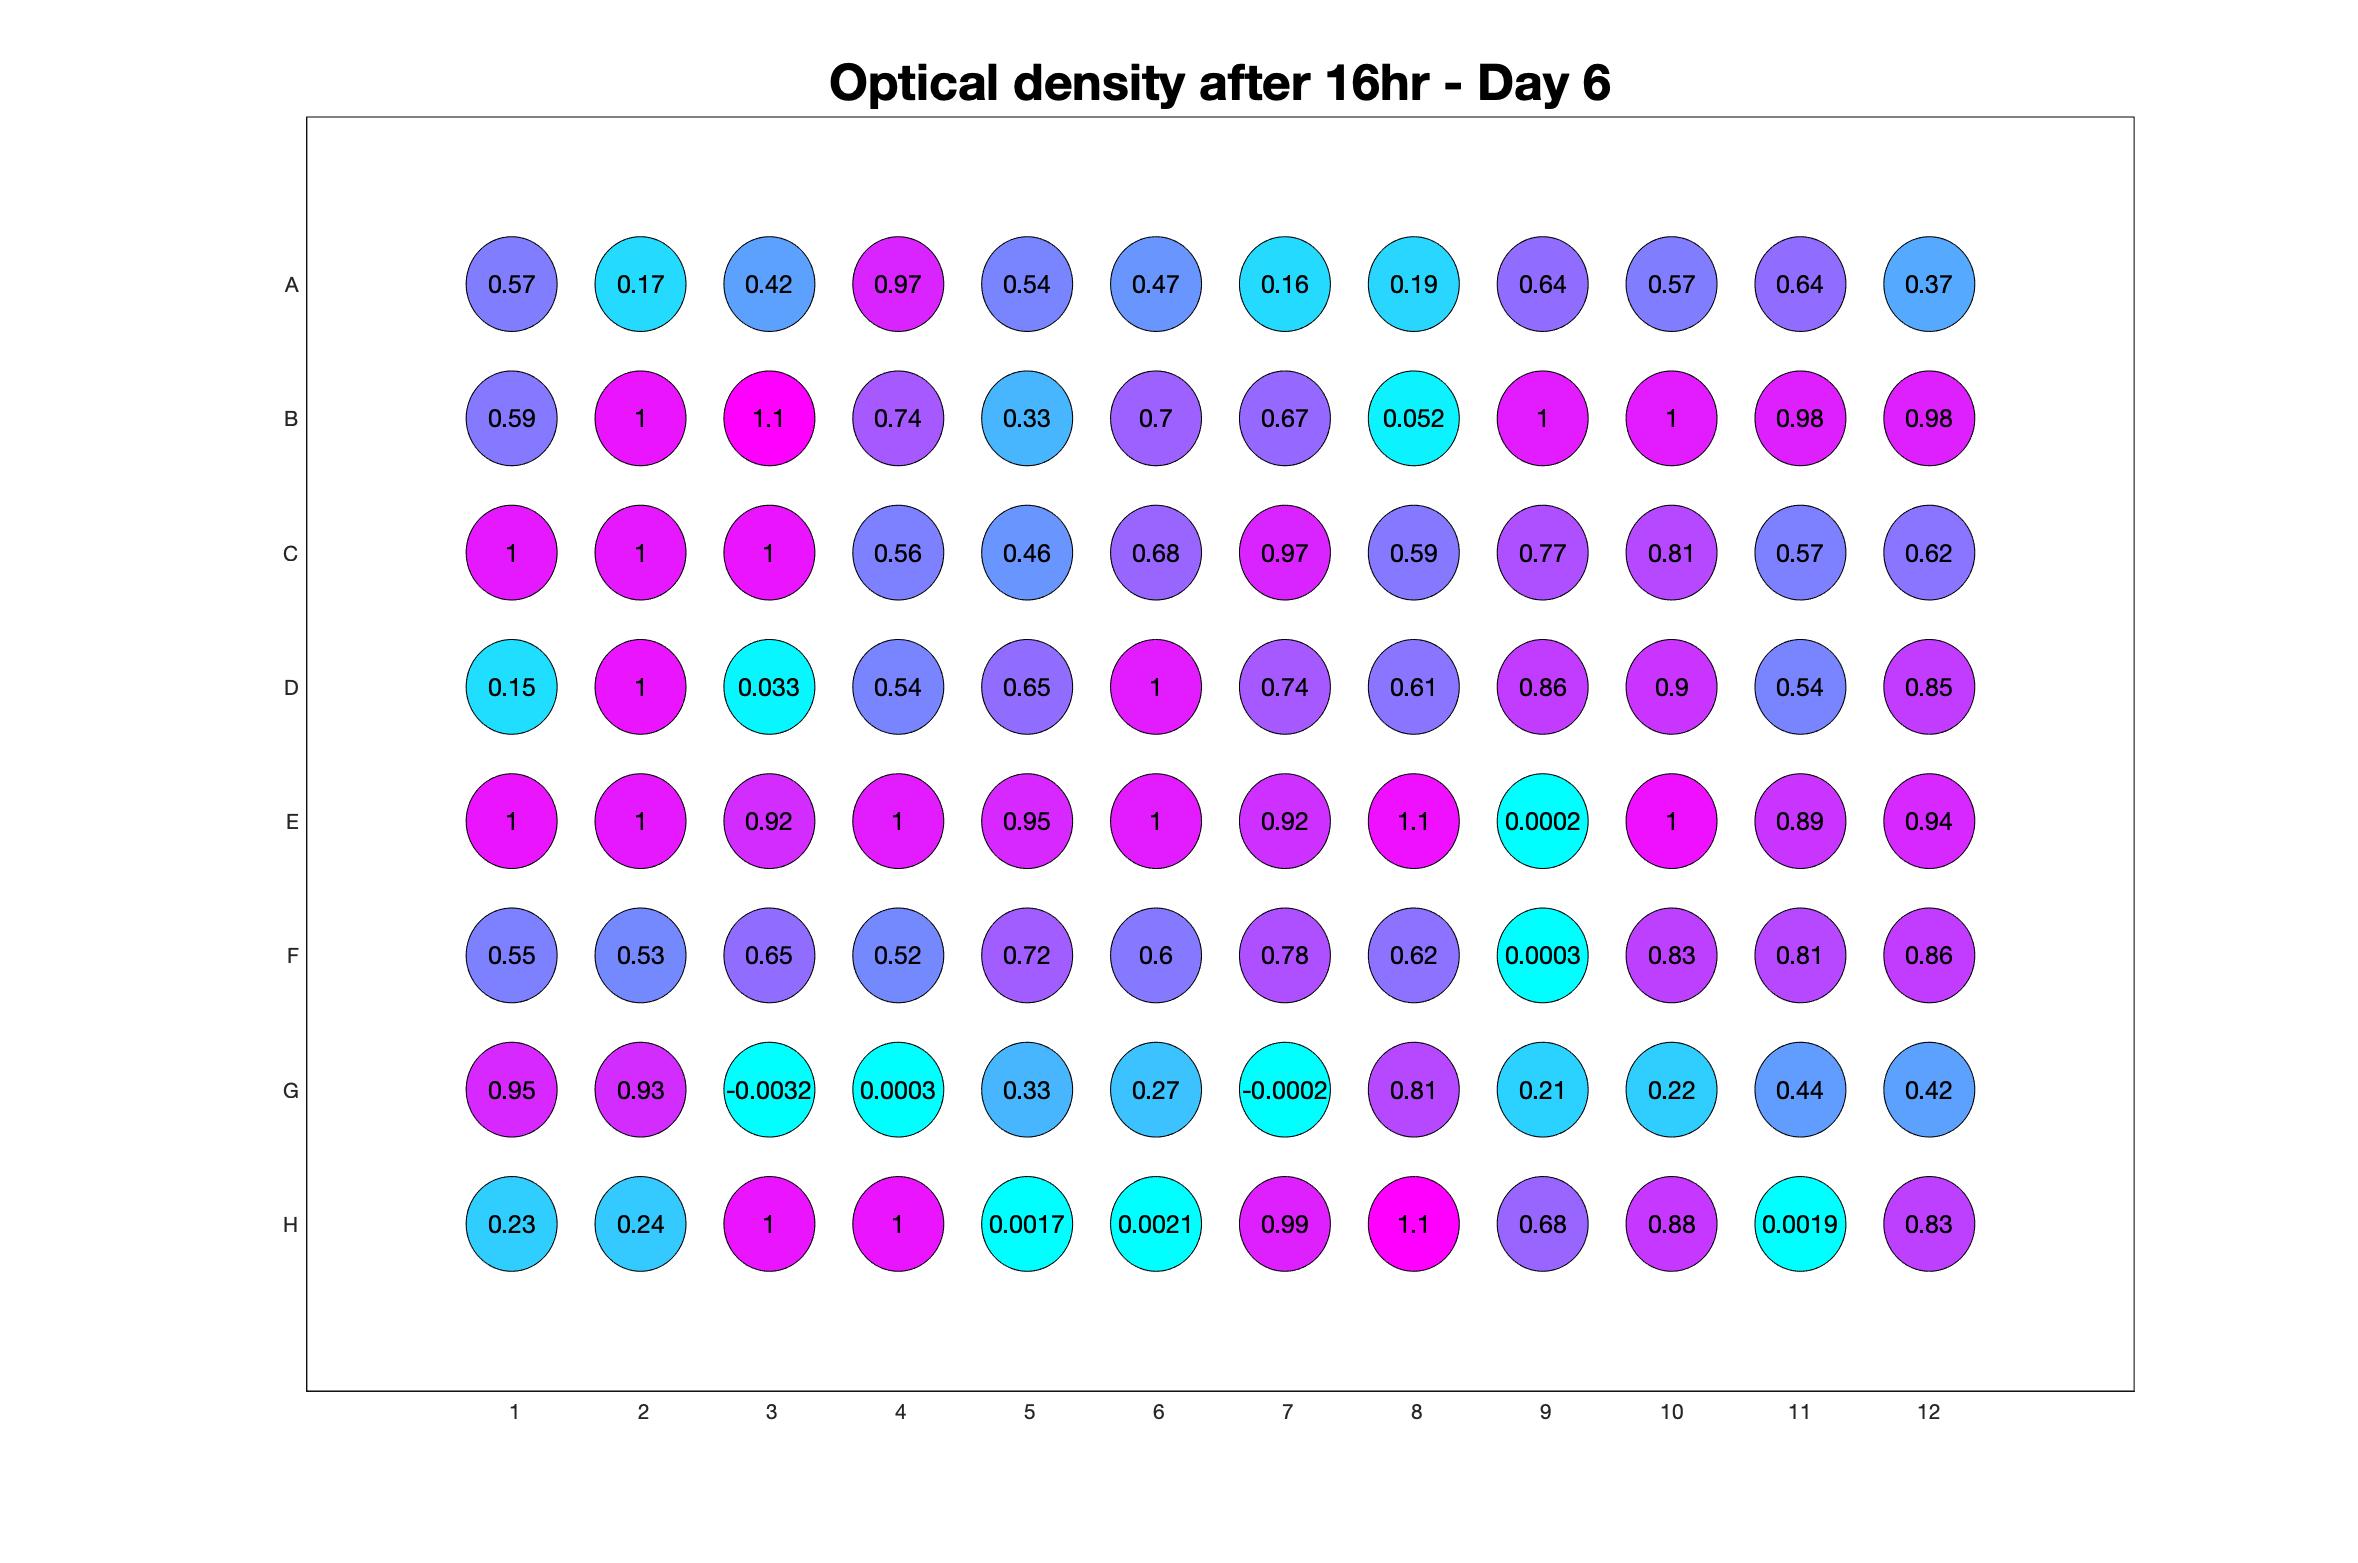
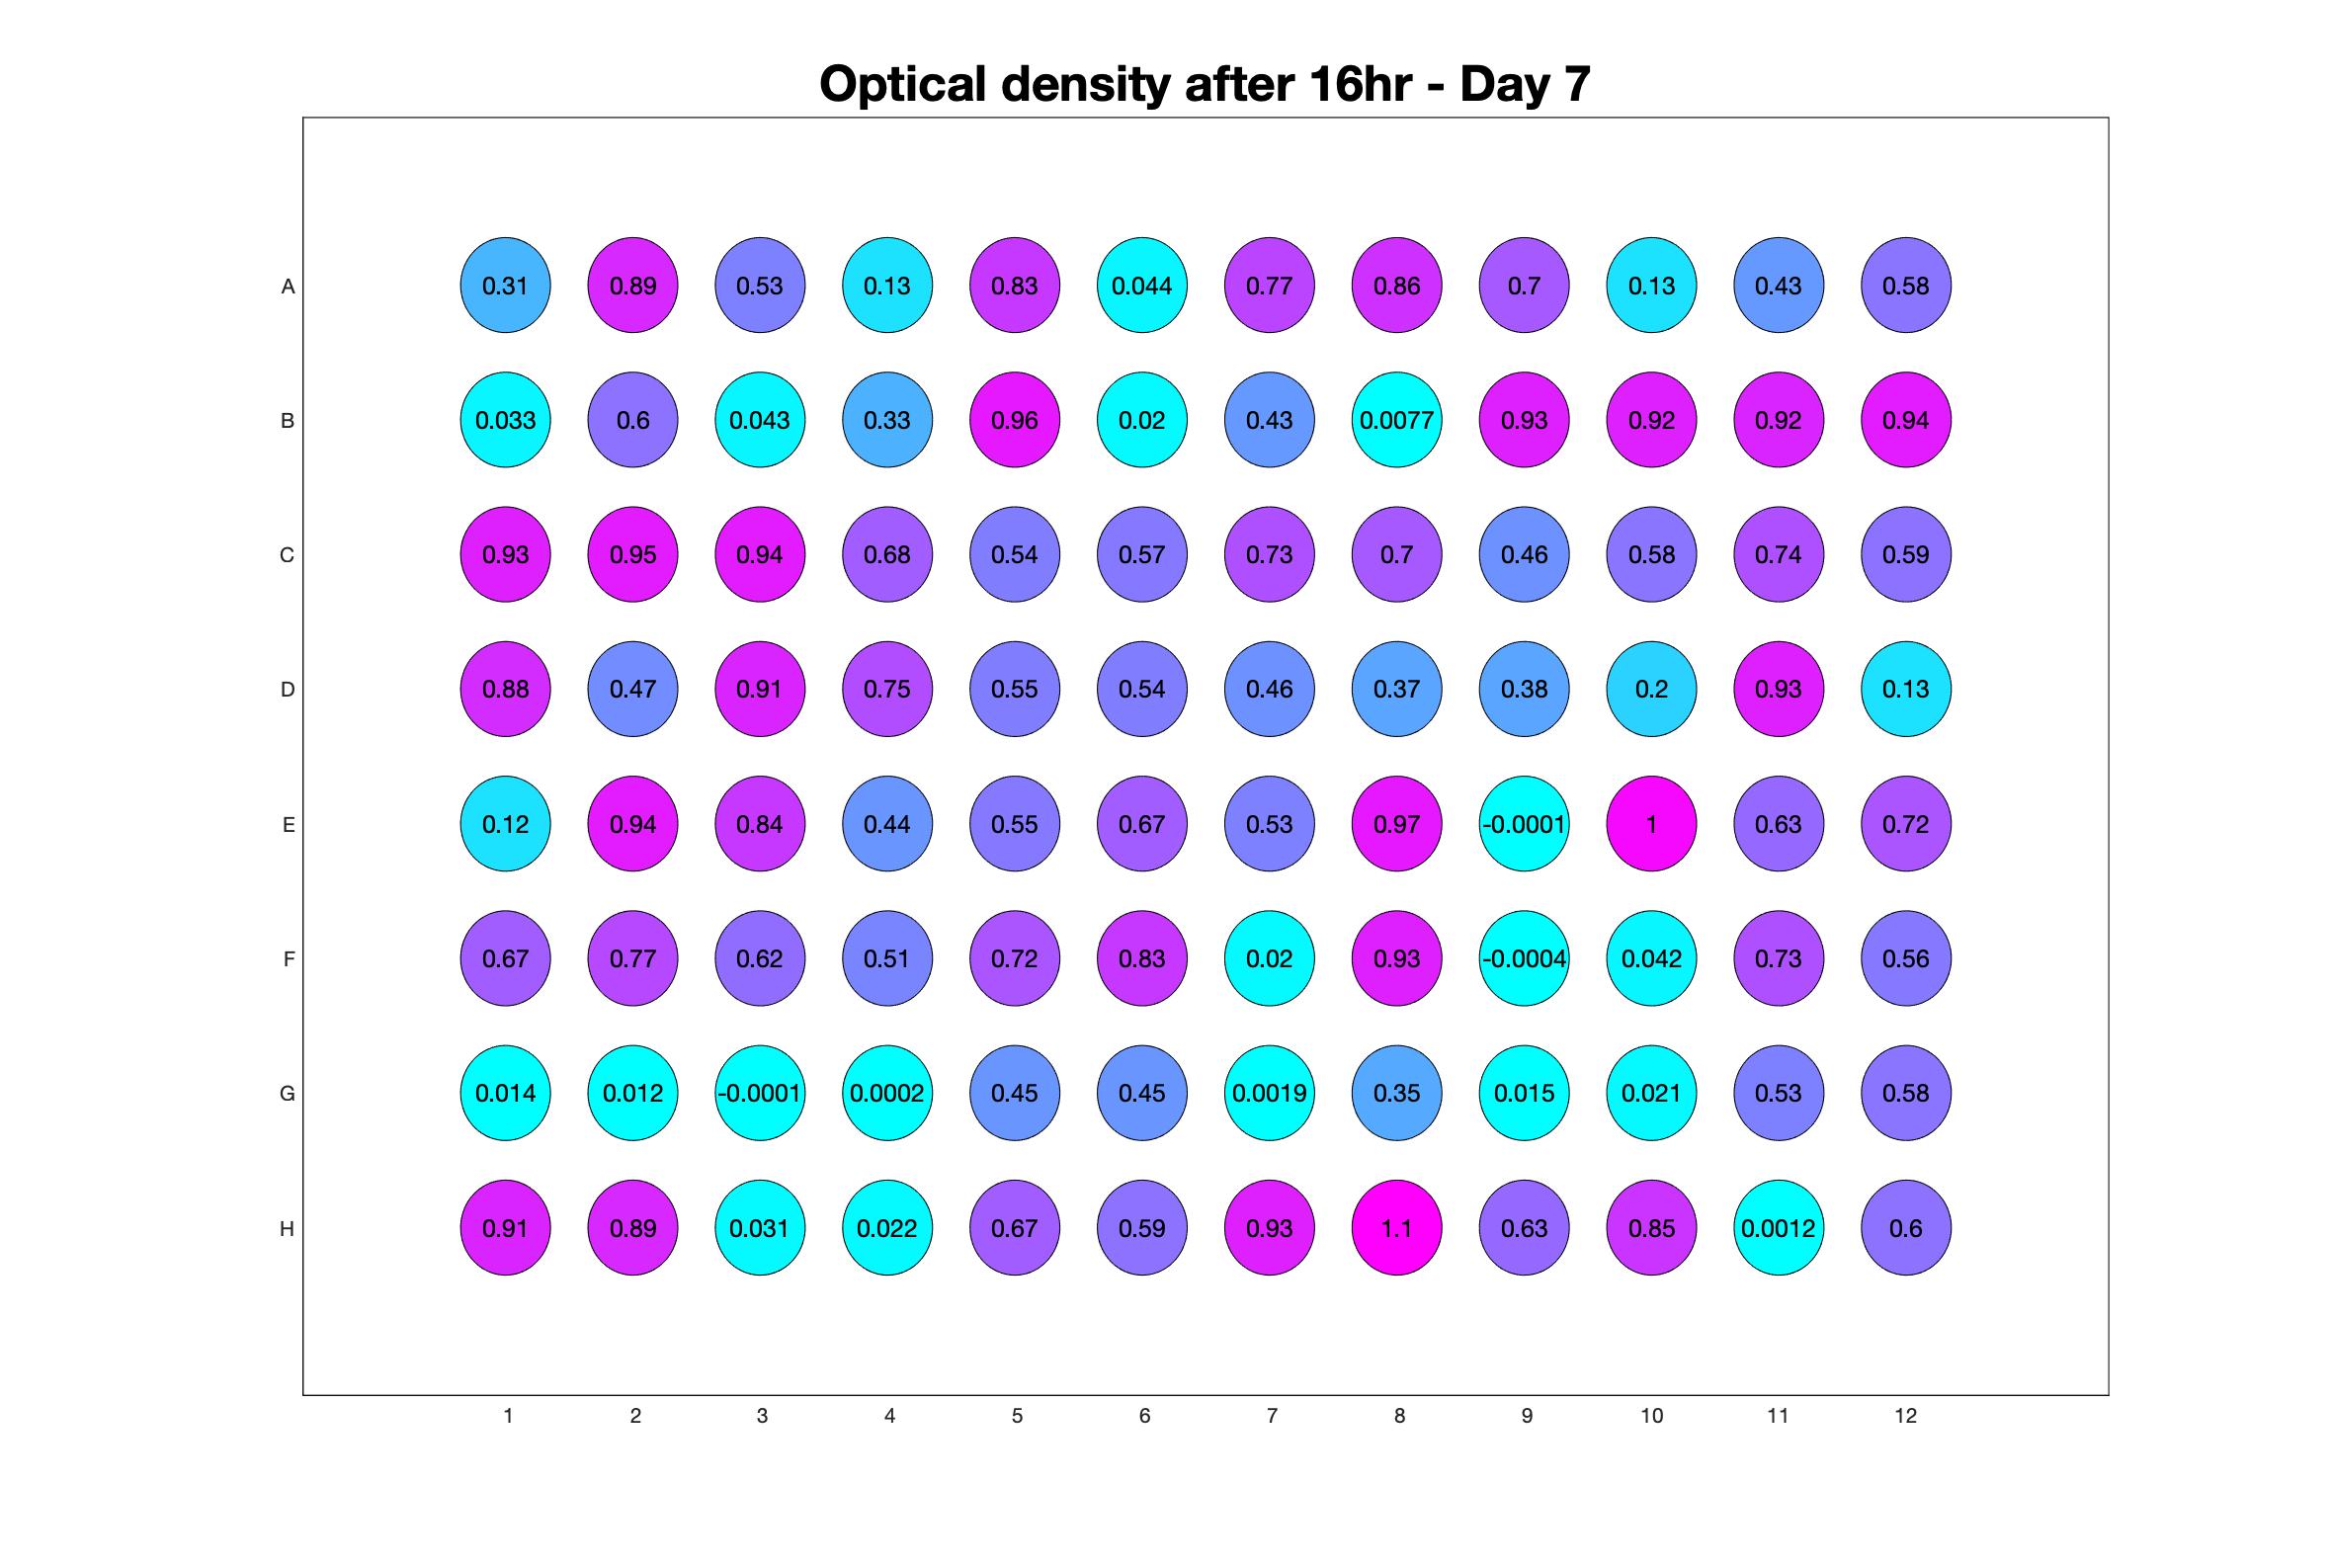
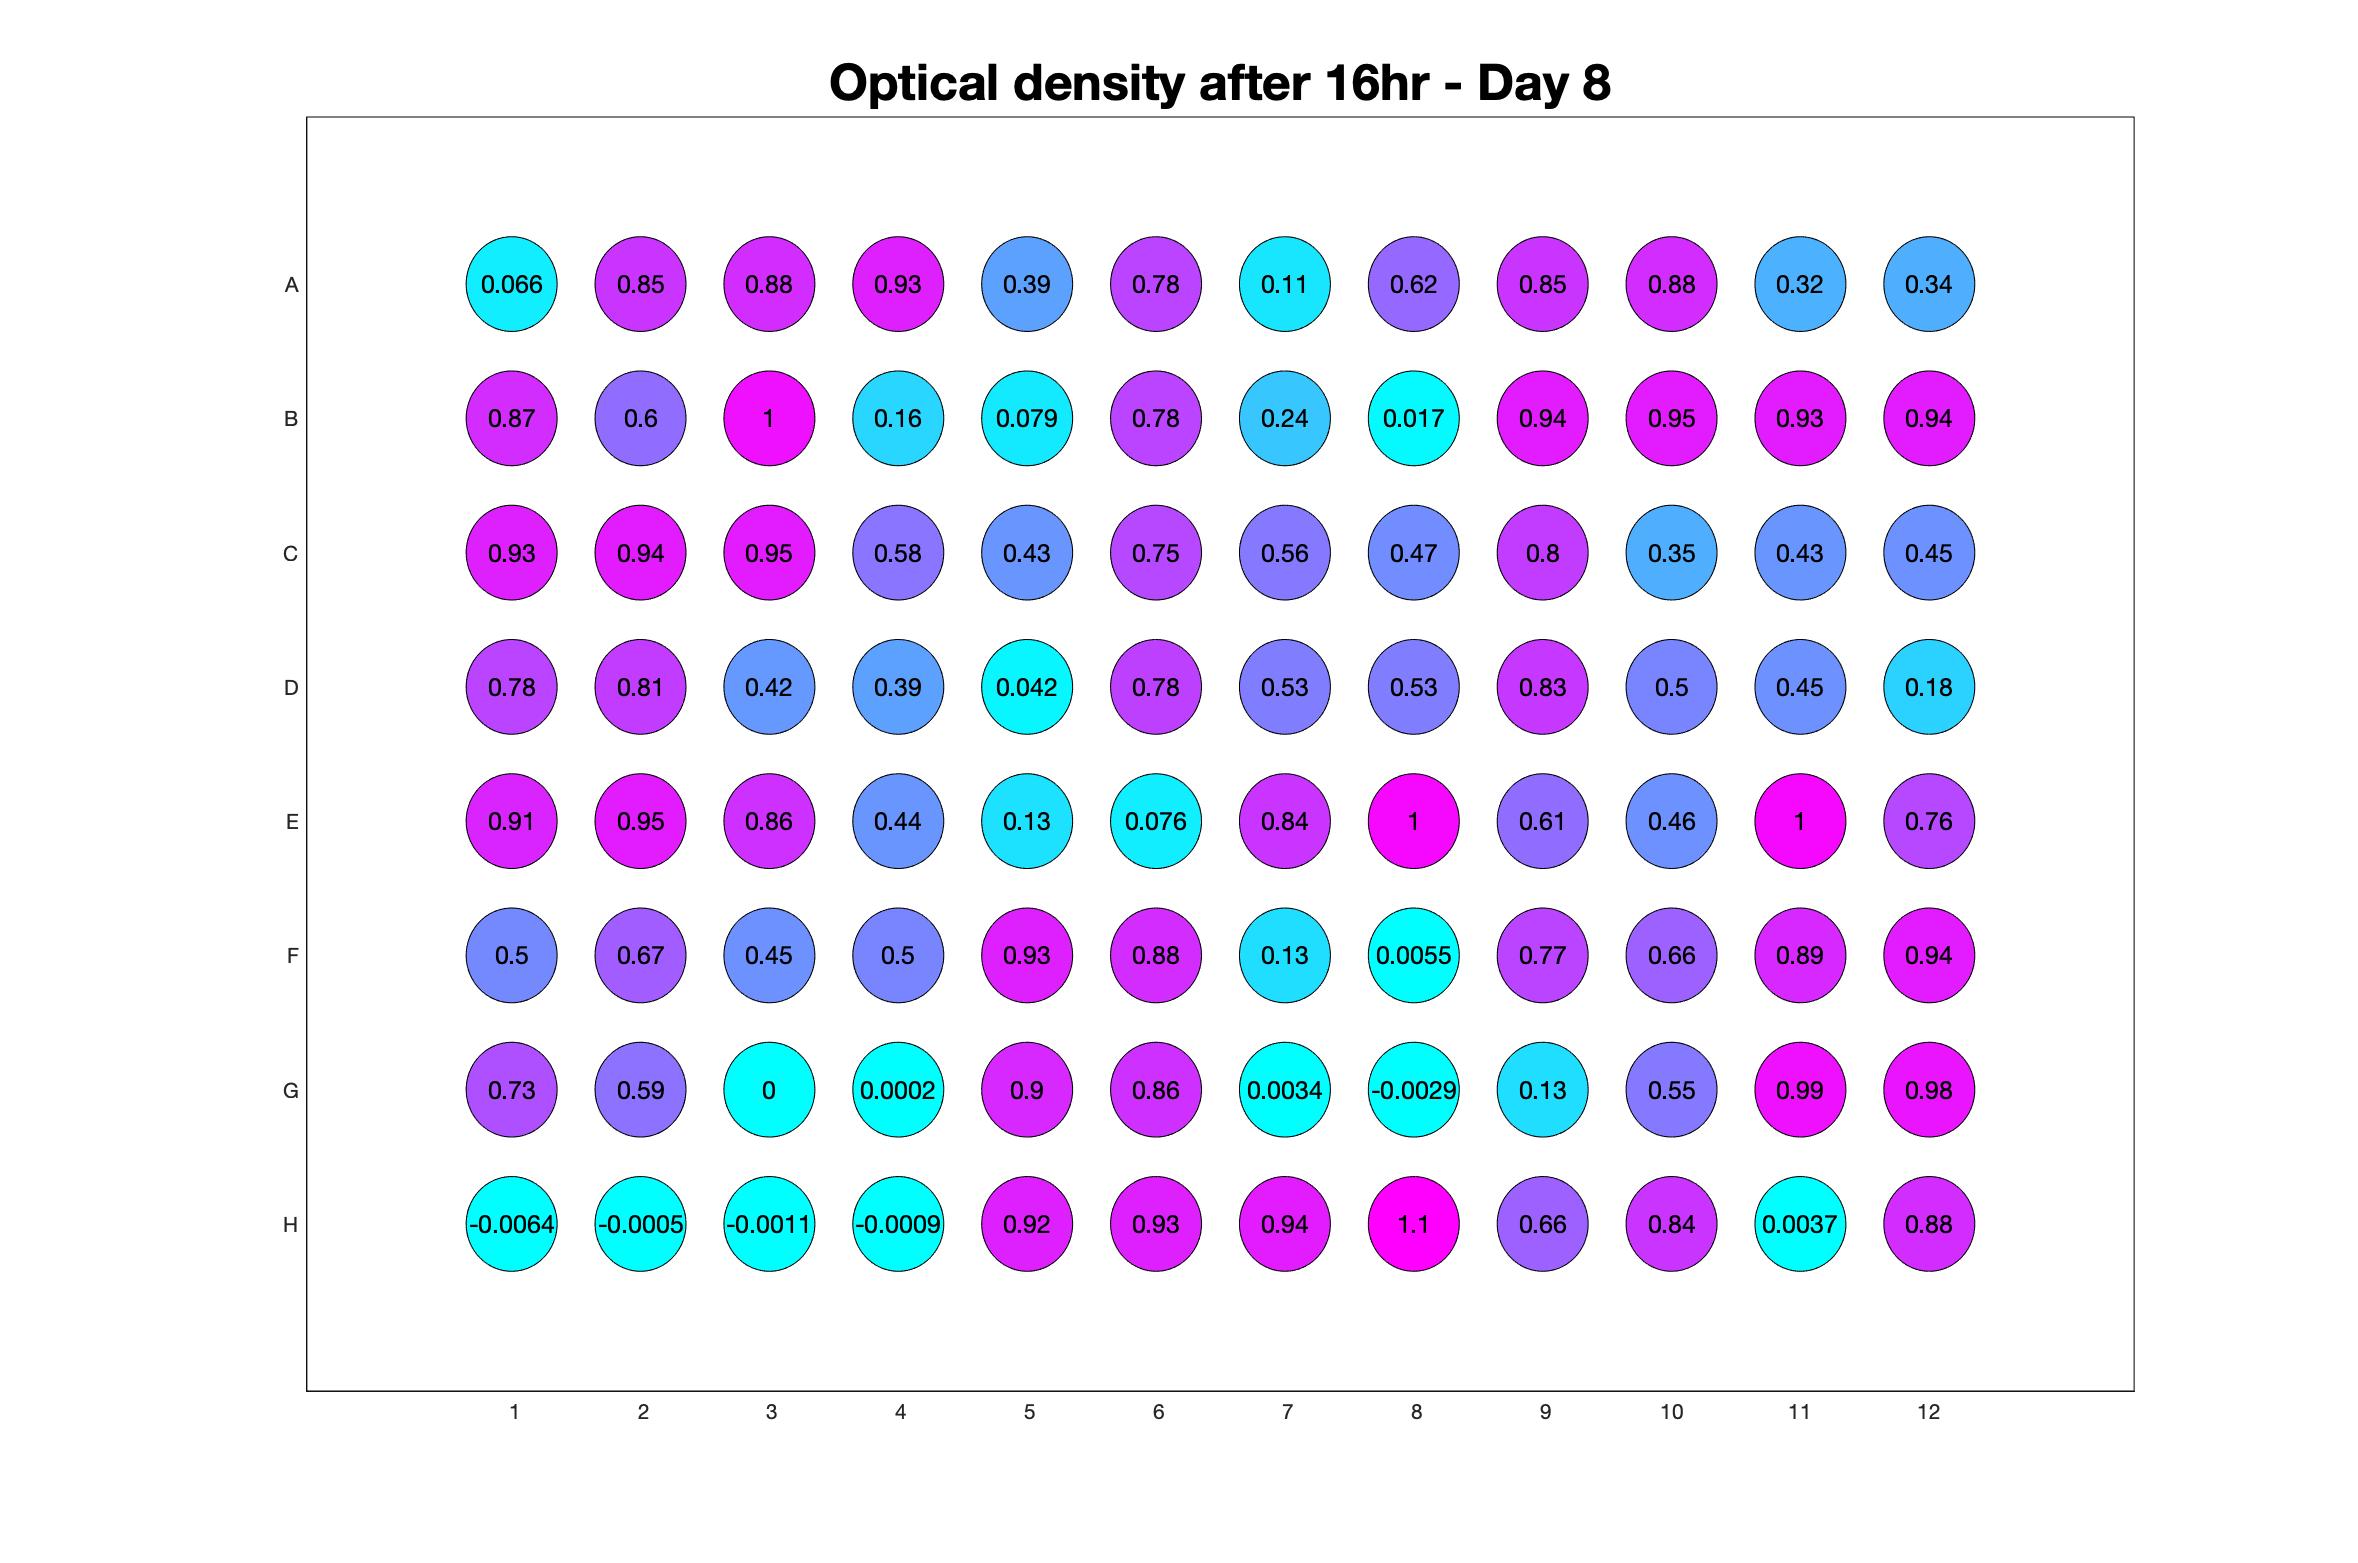
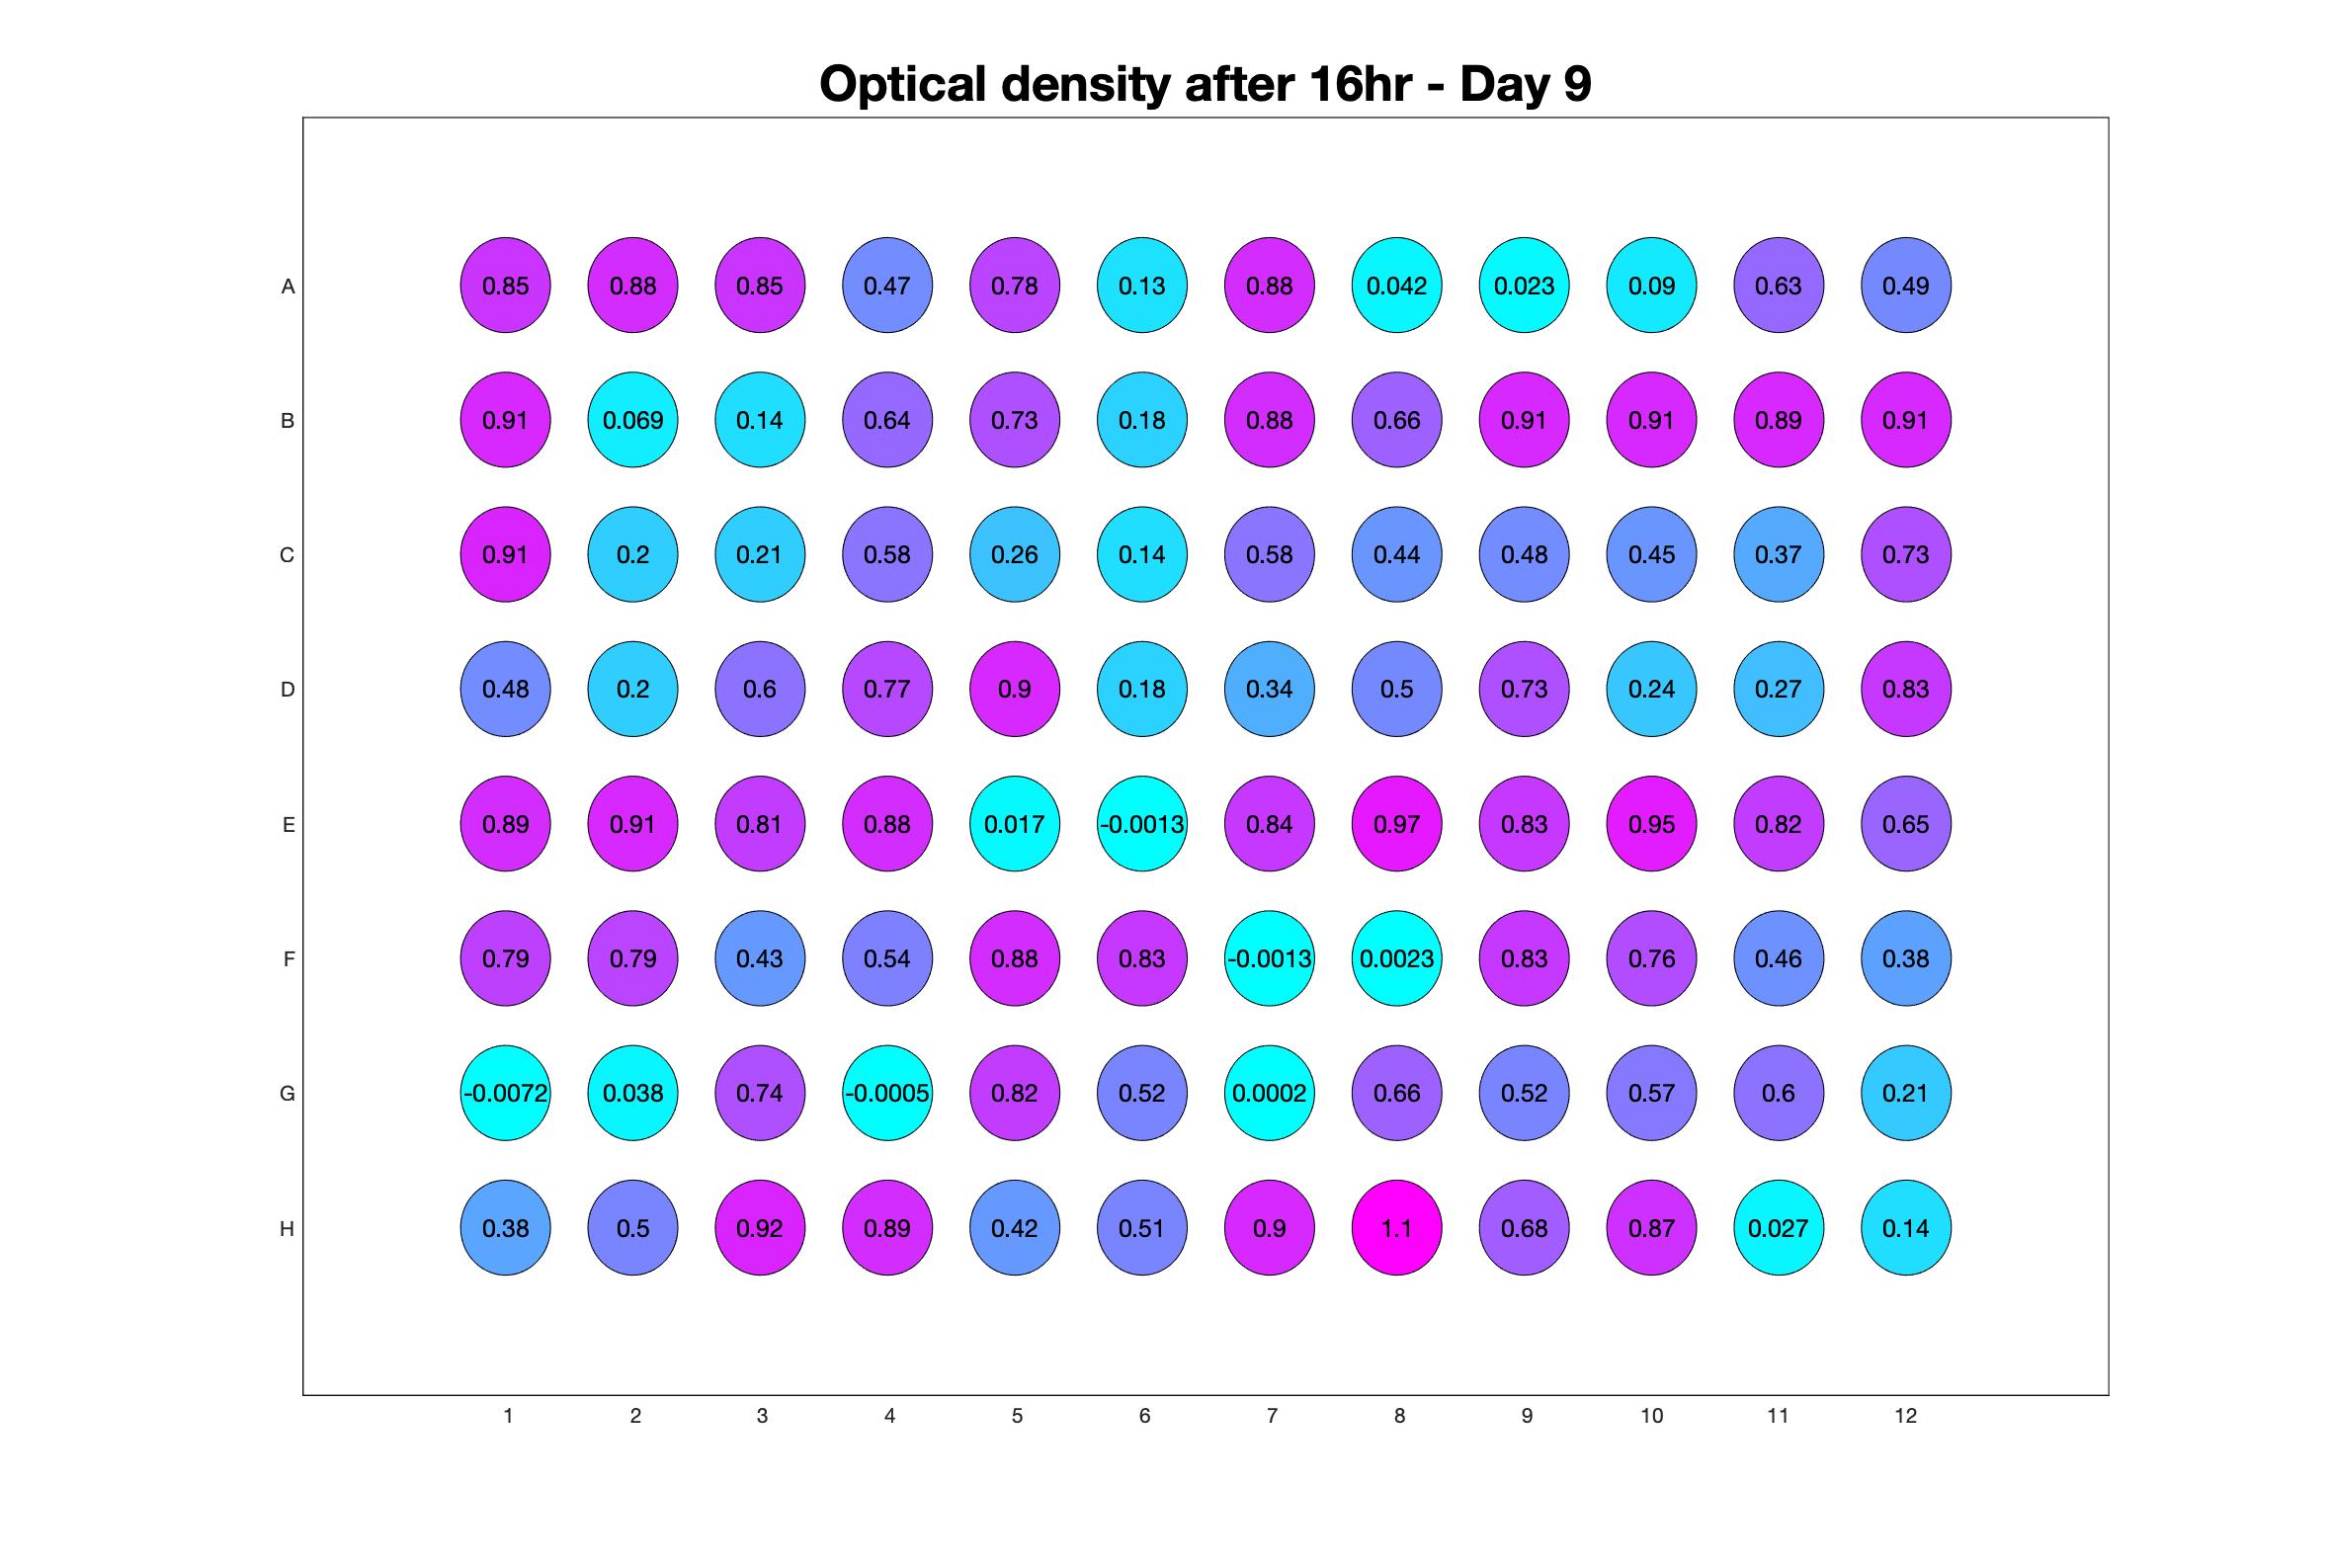
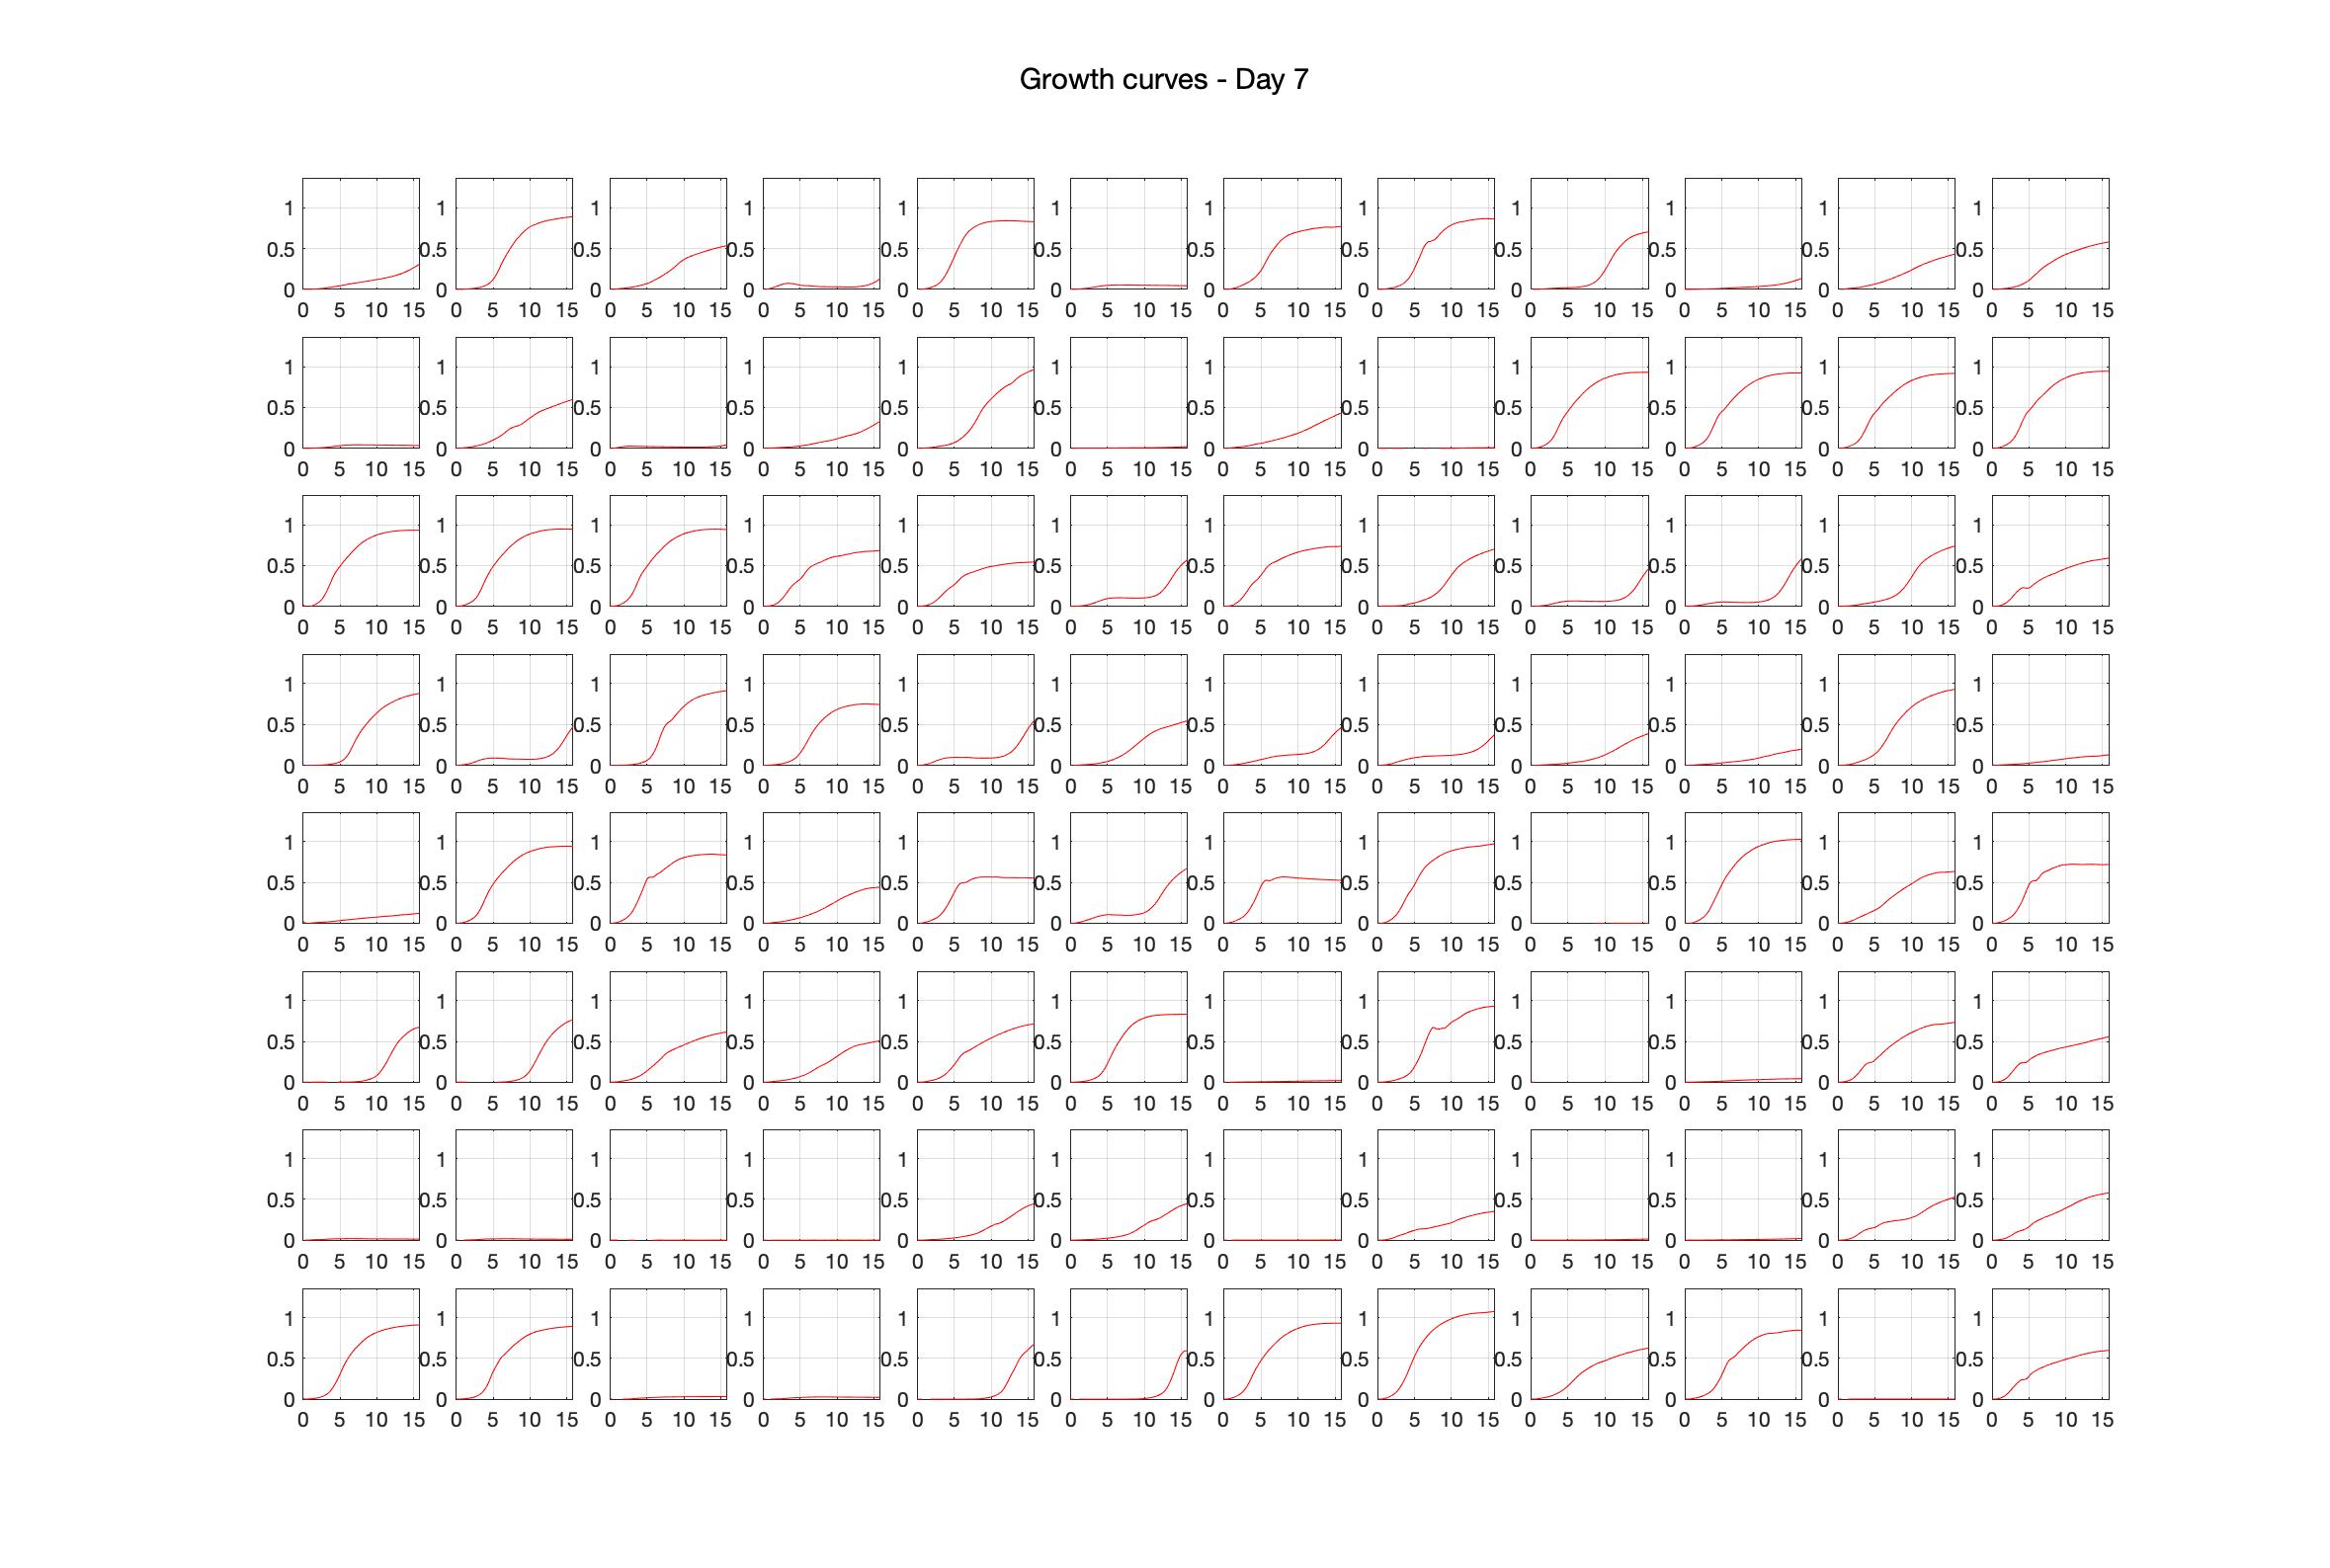
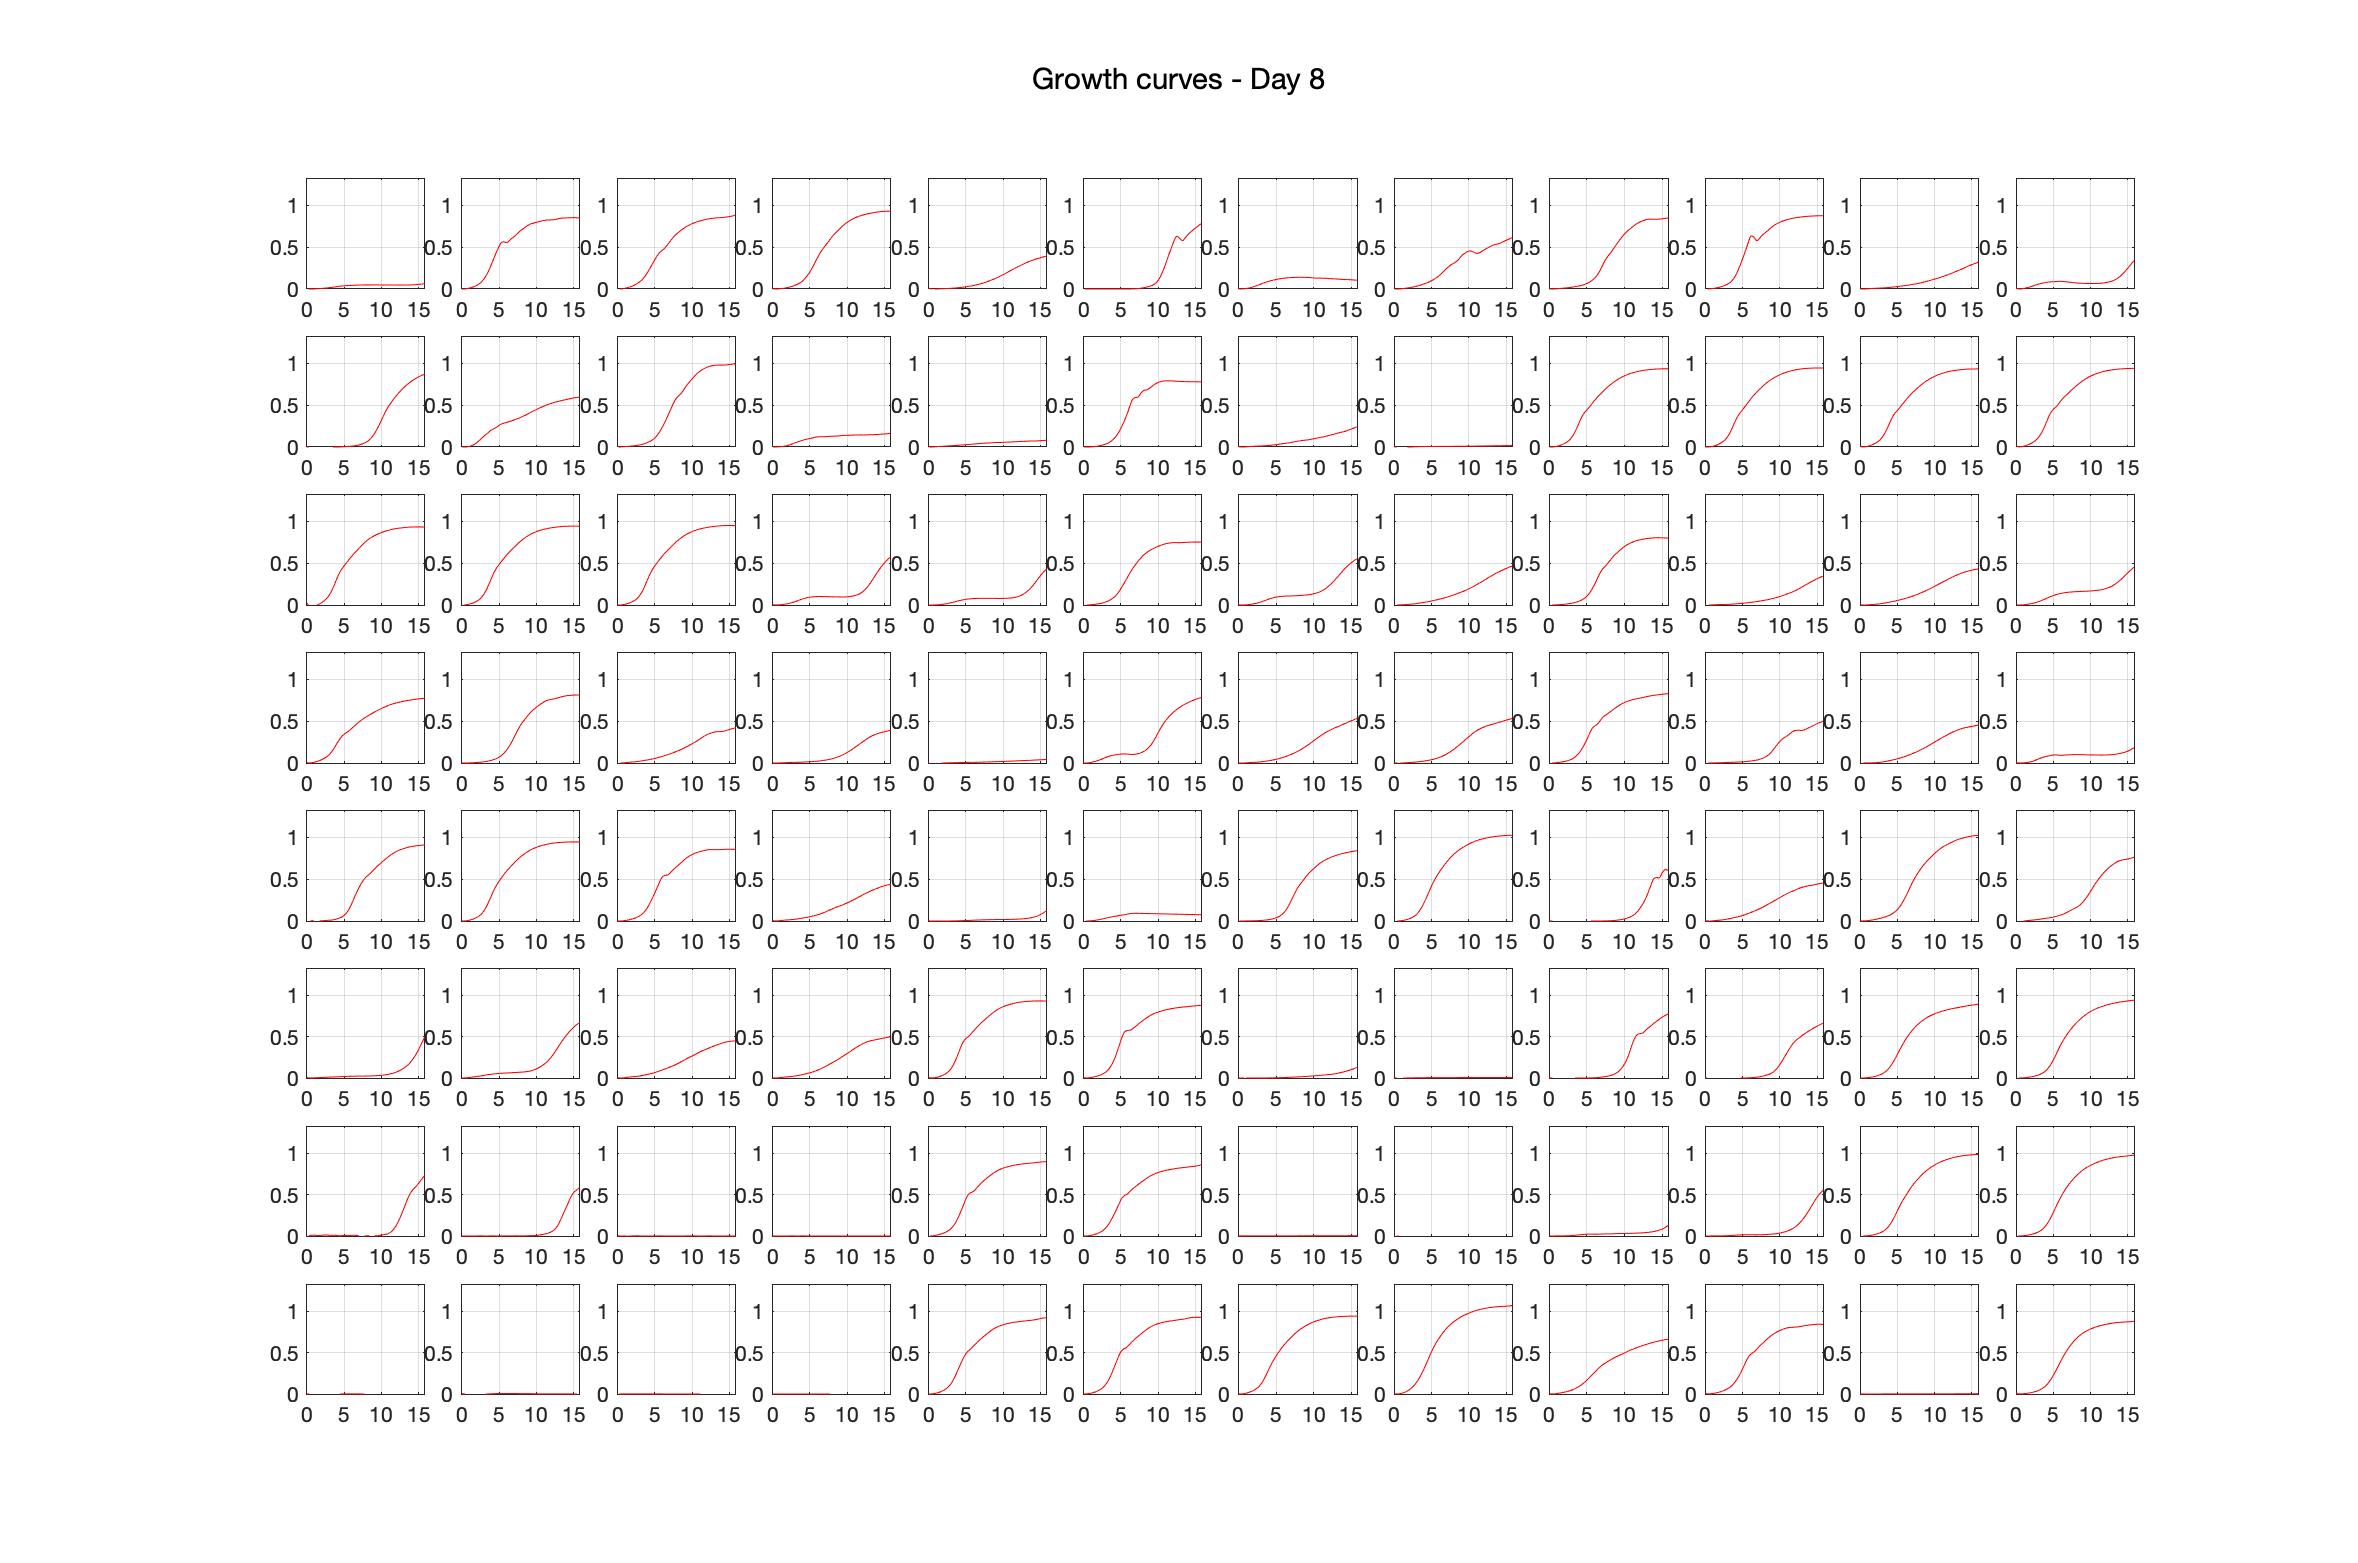
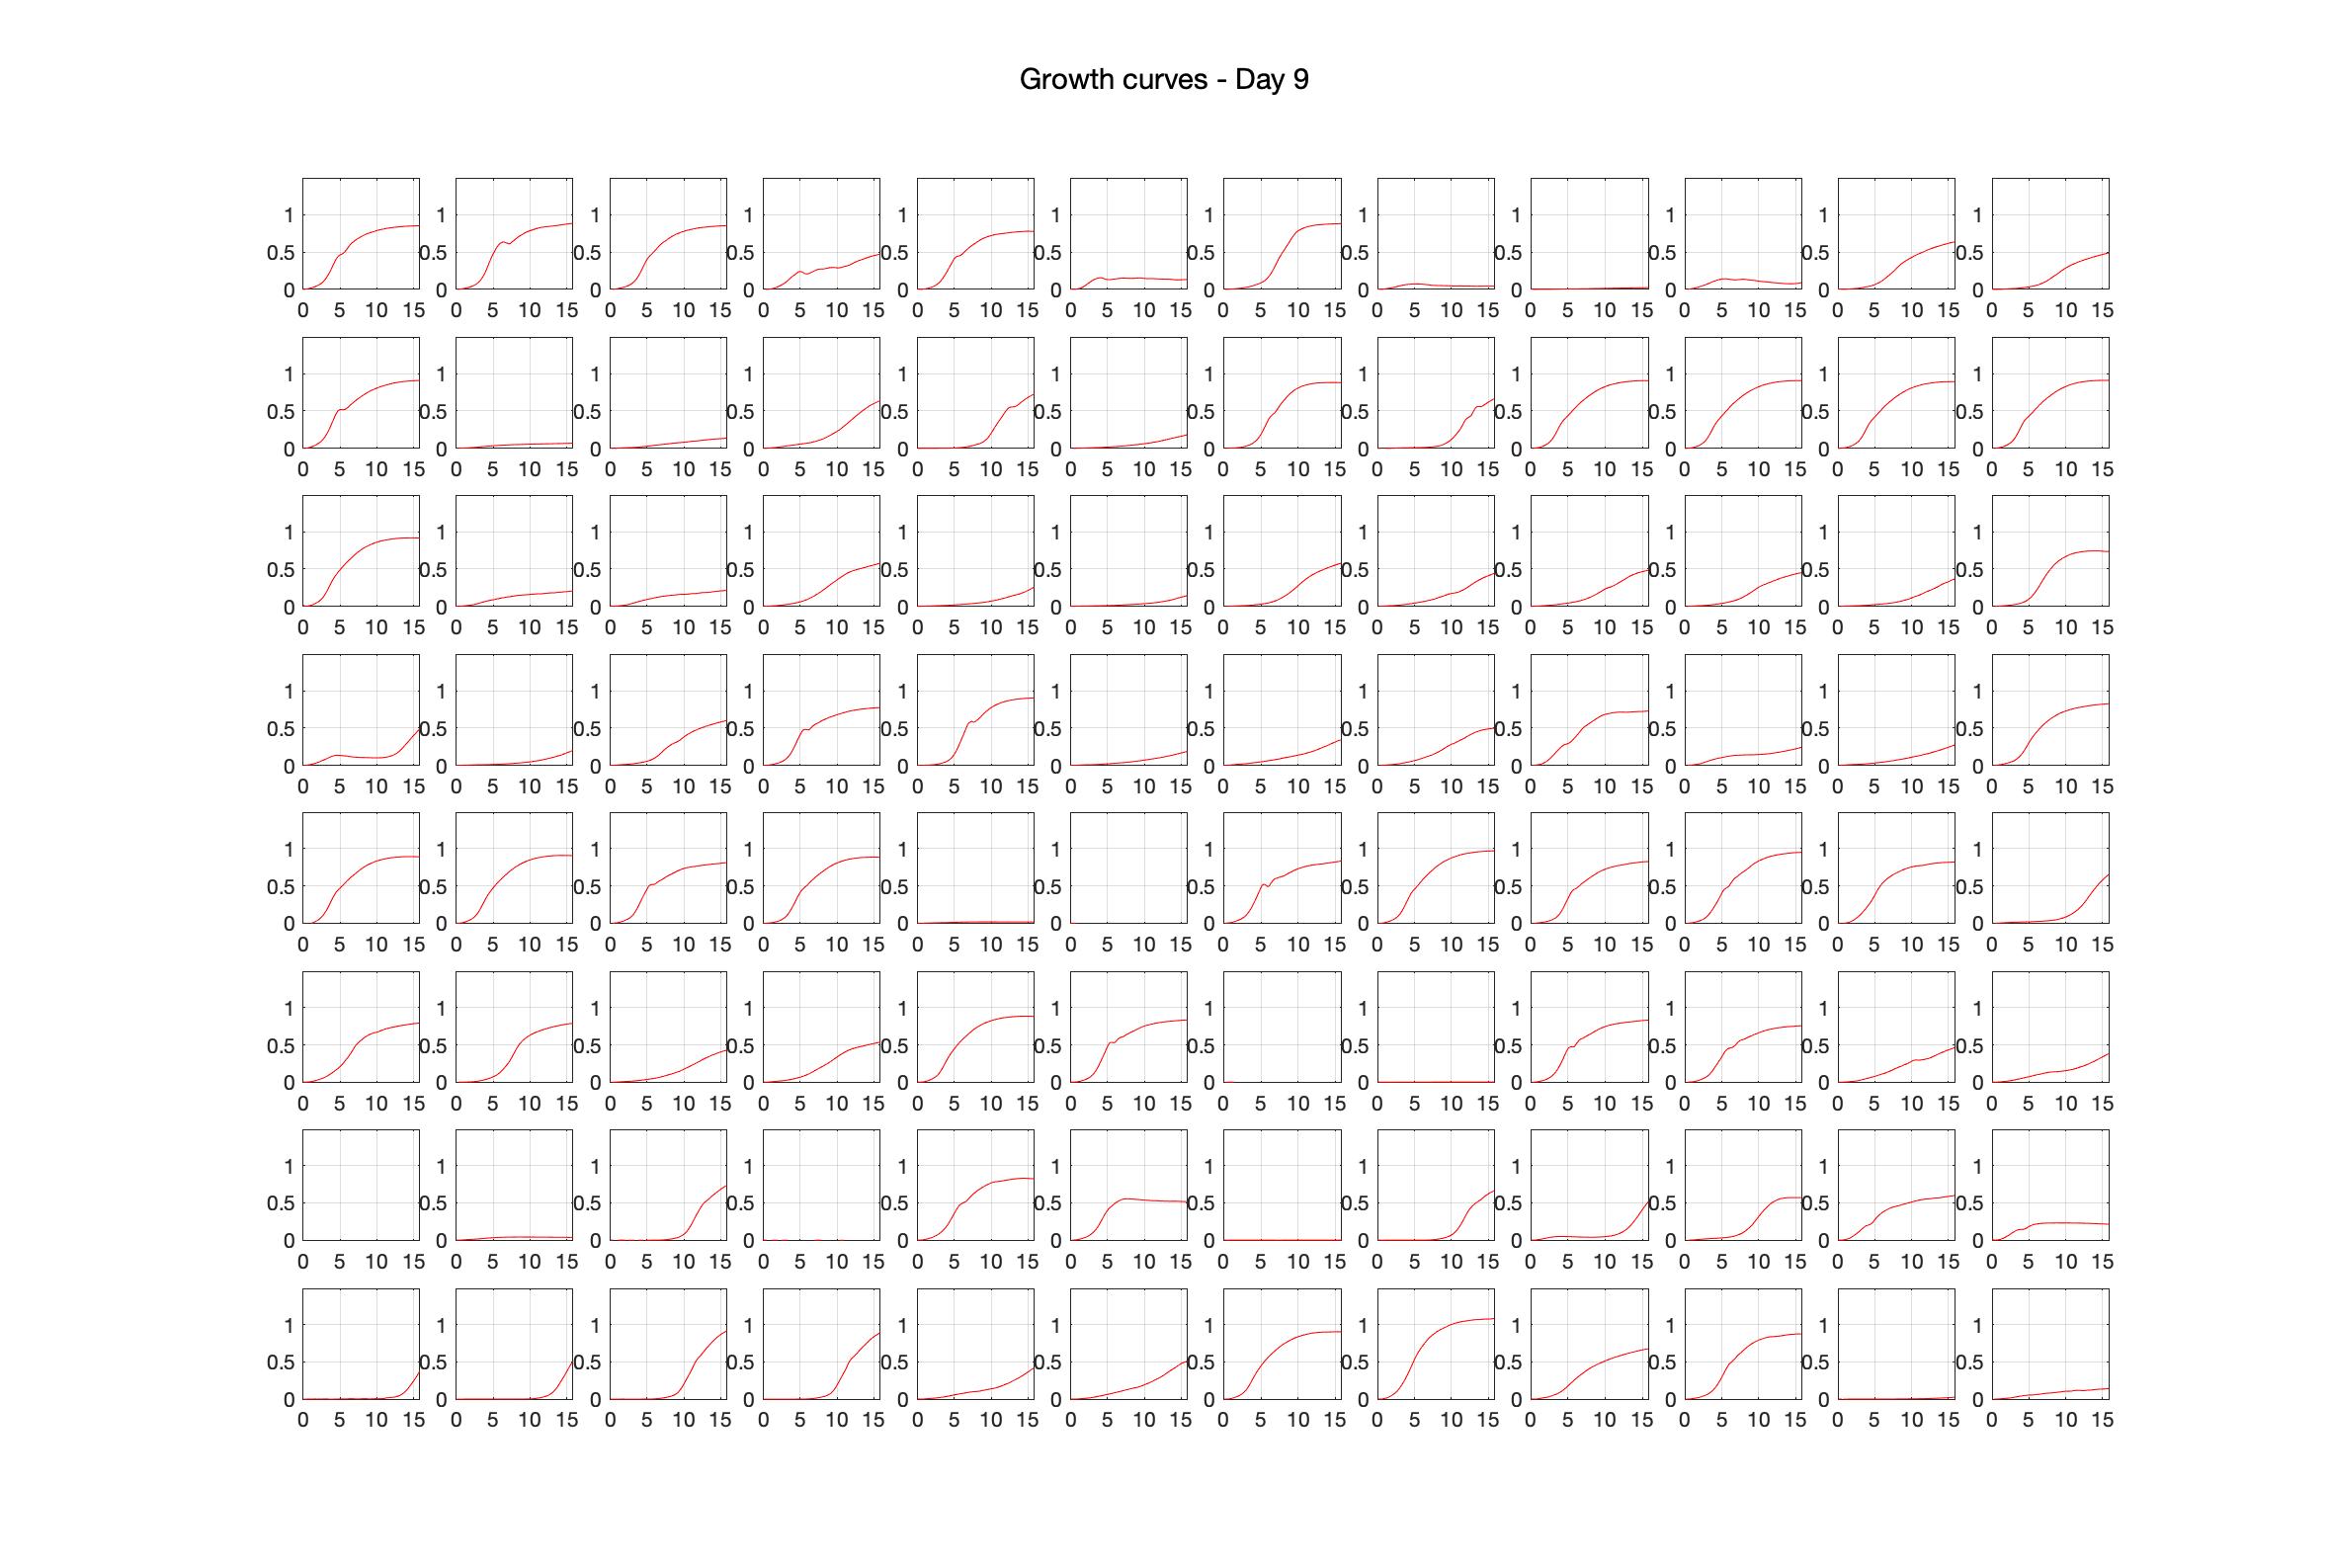
Daily observed optical density (16hr)
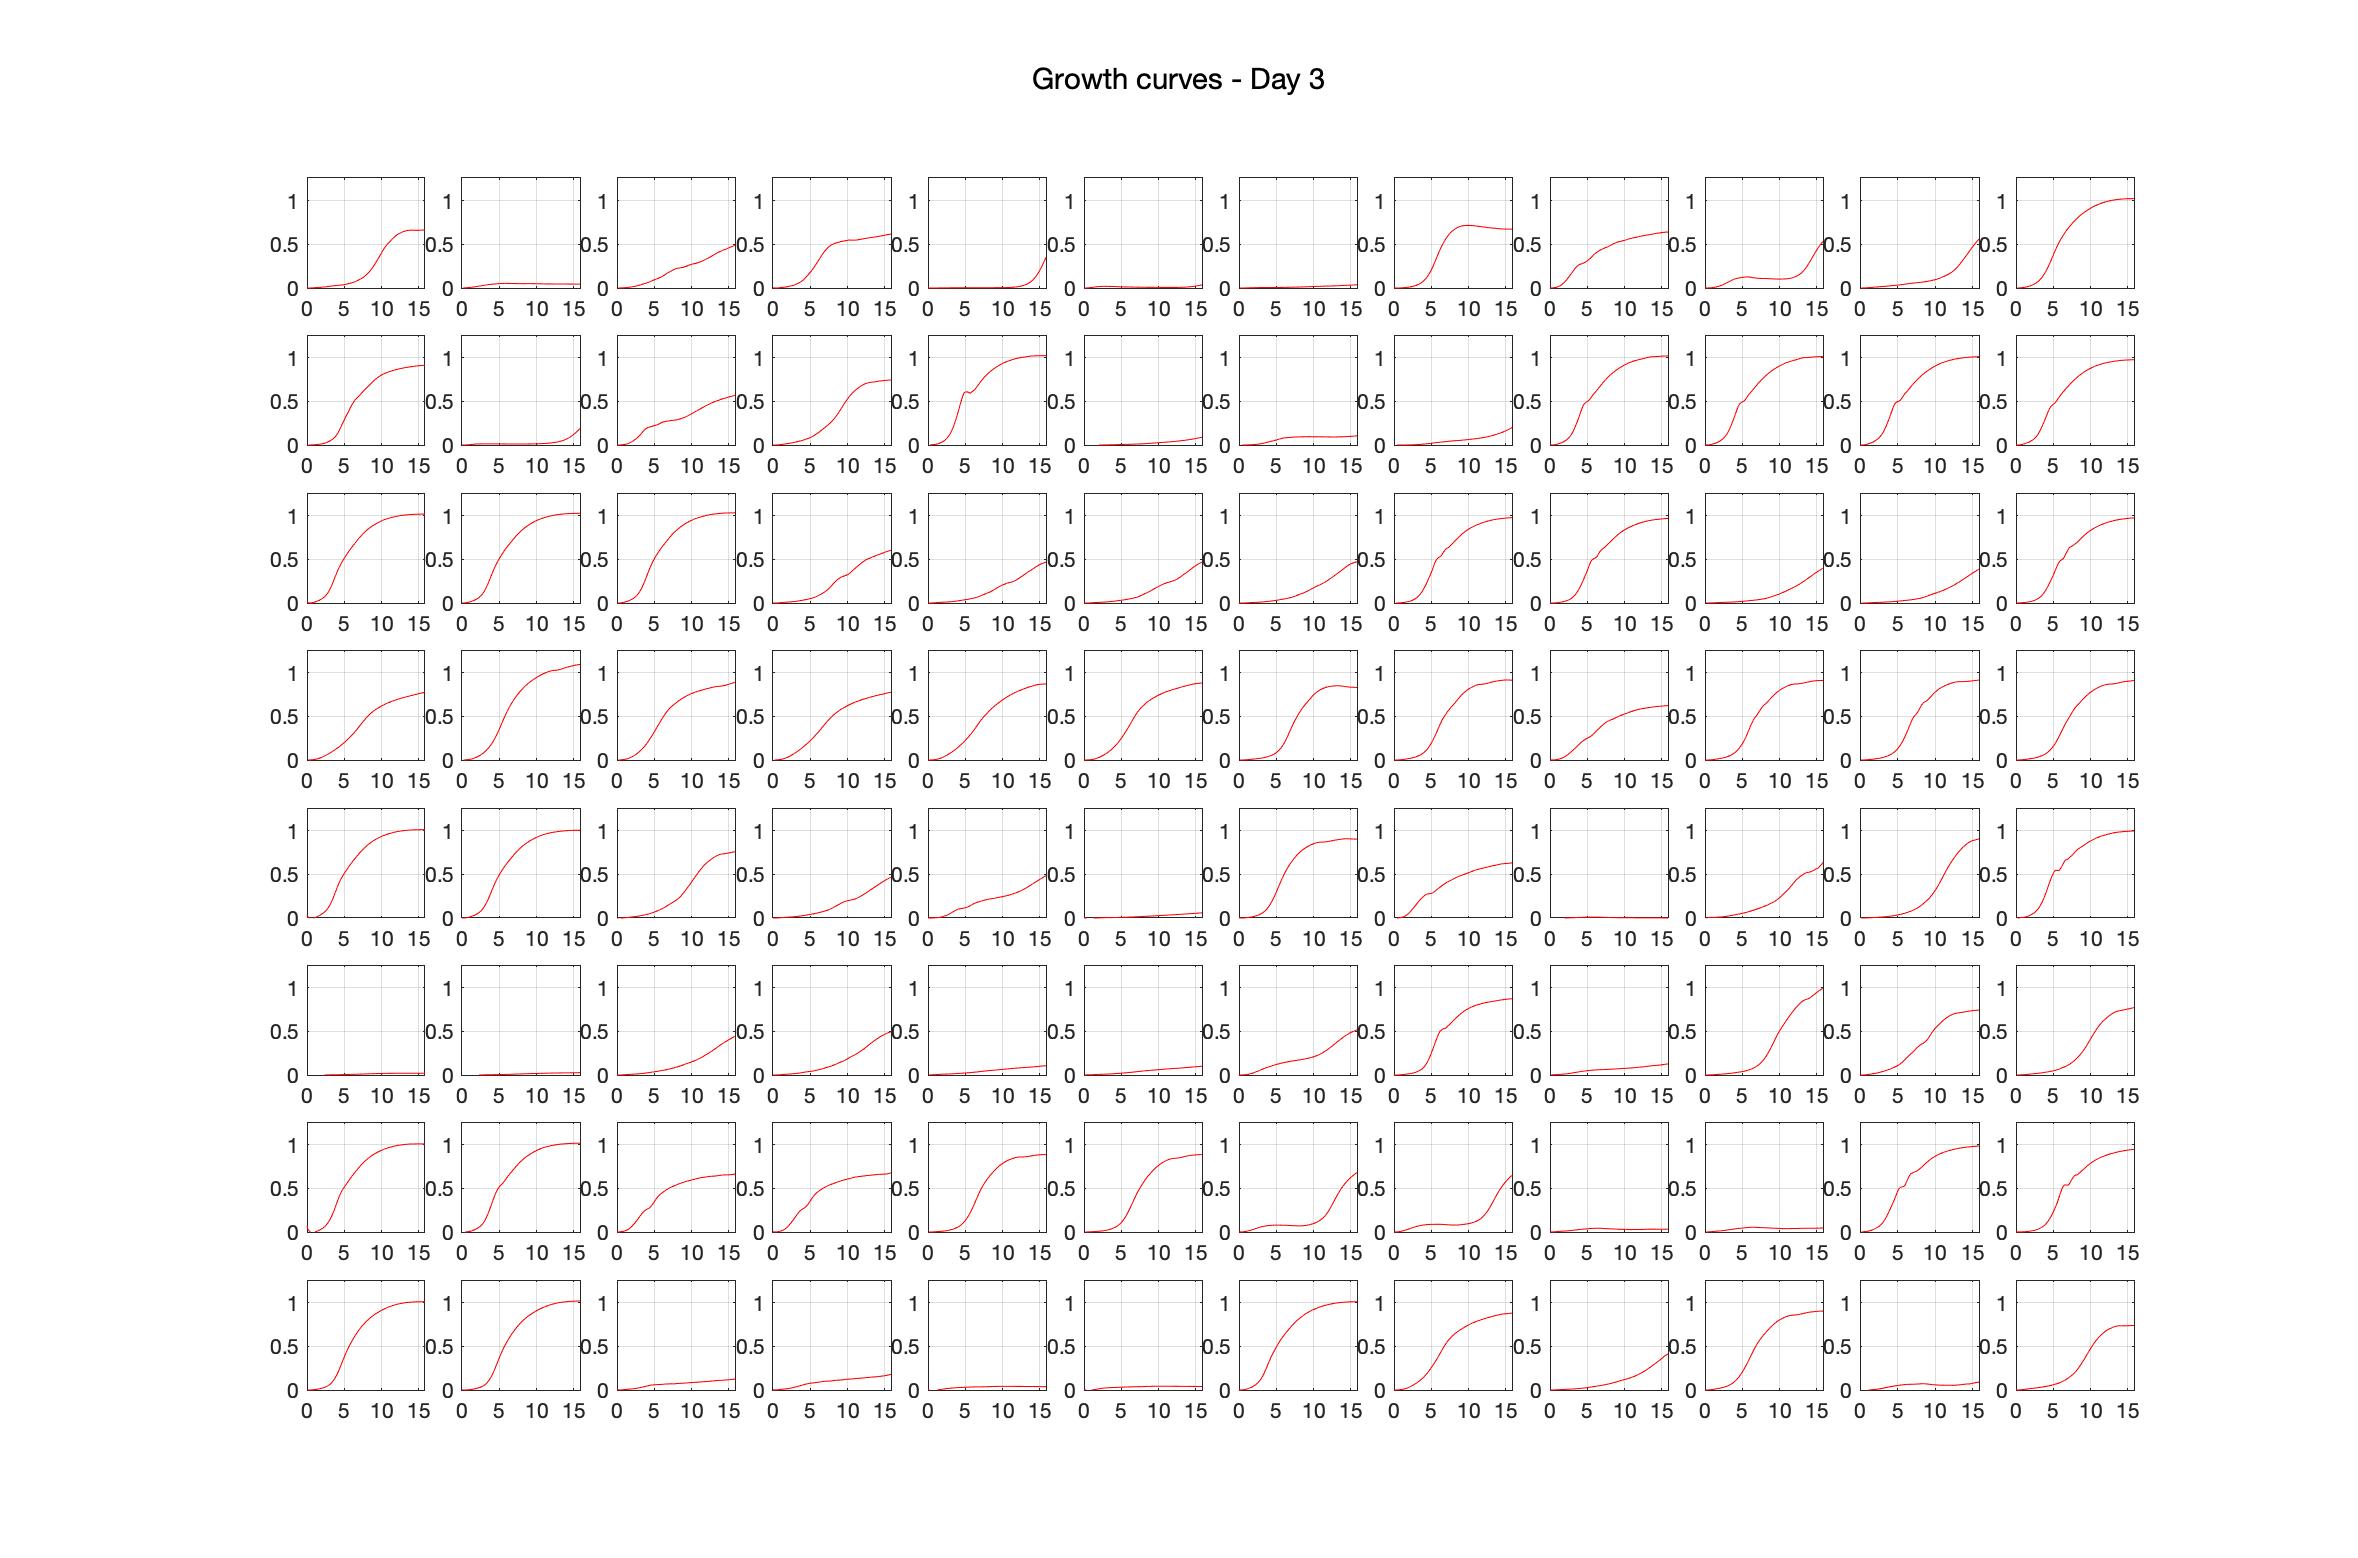
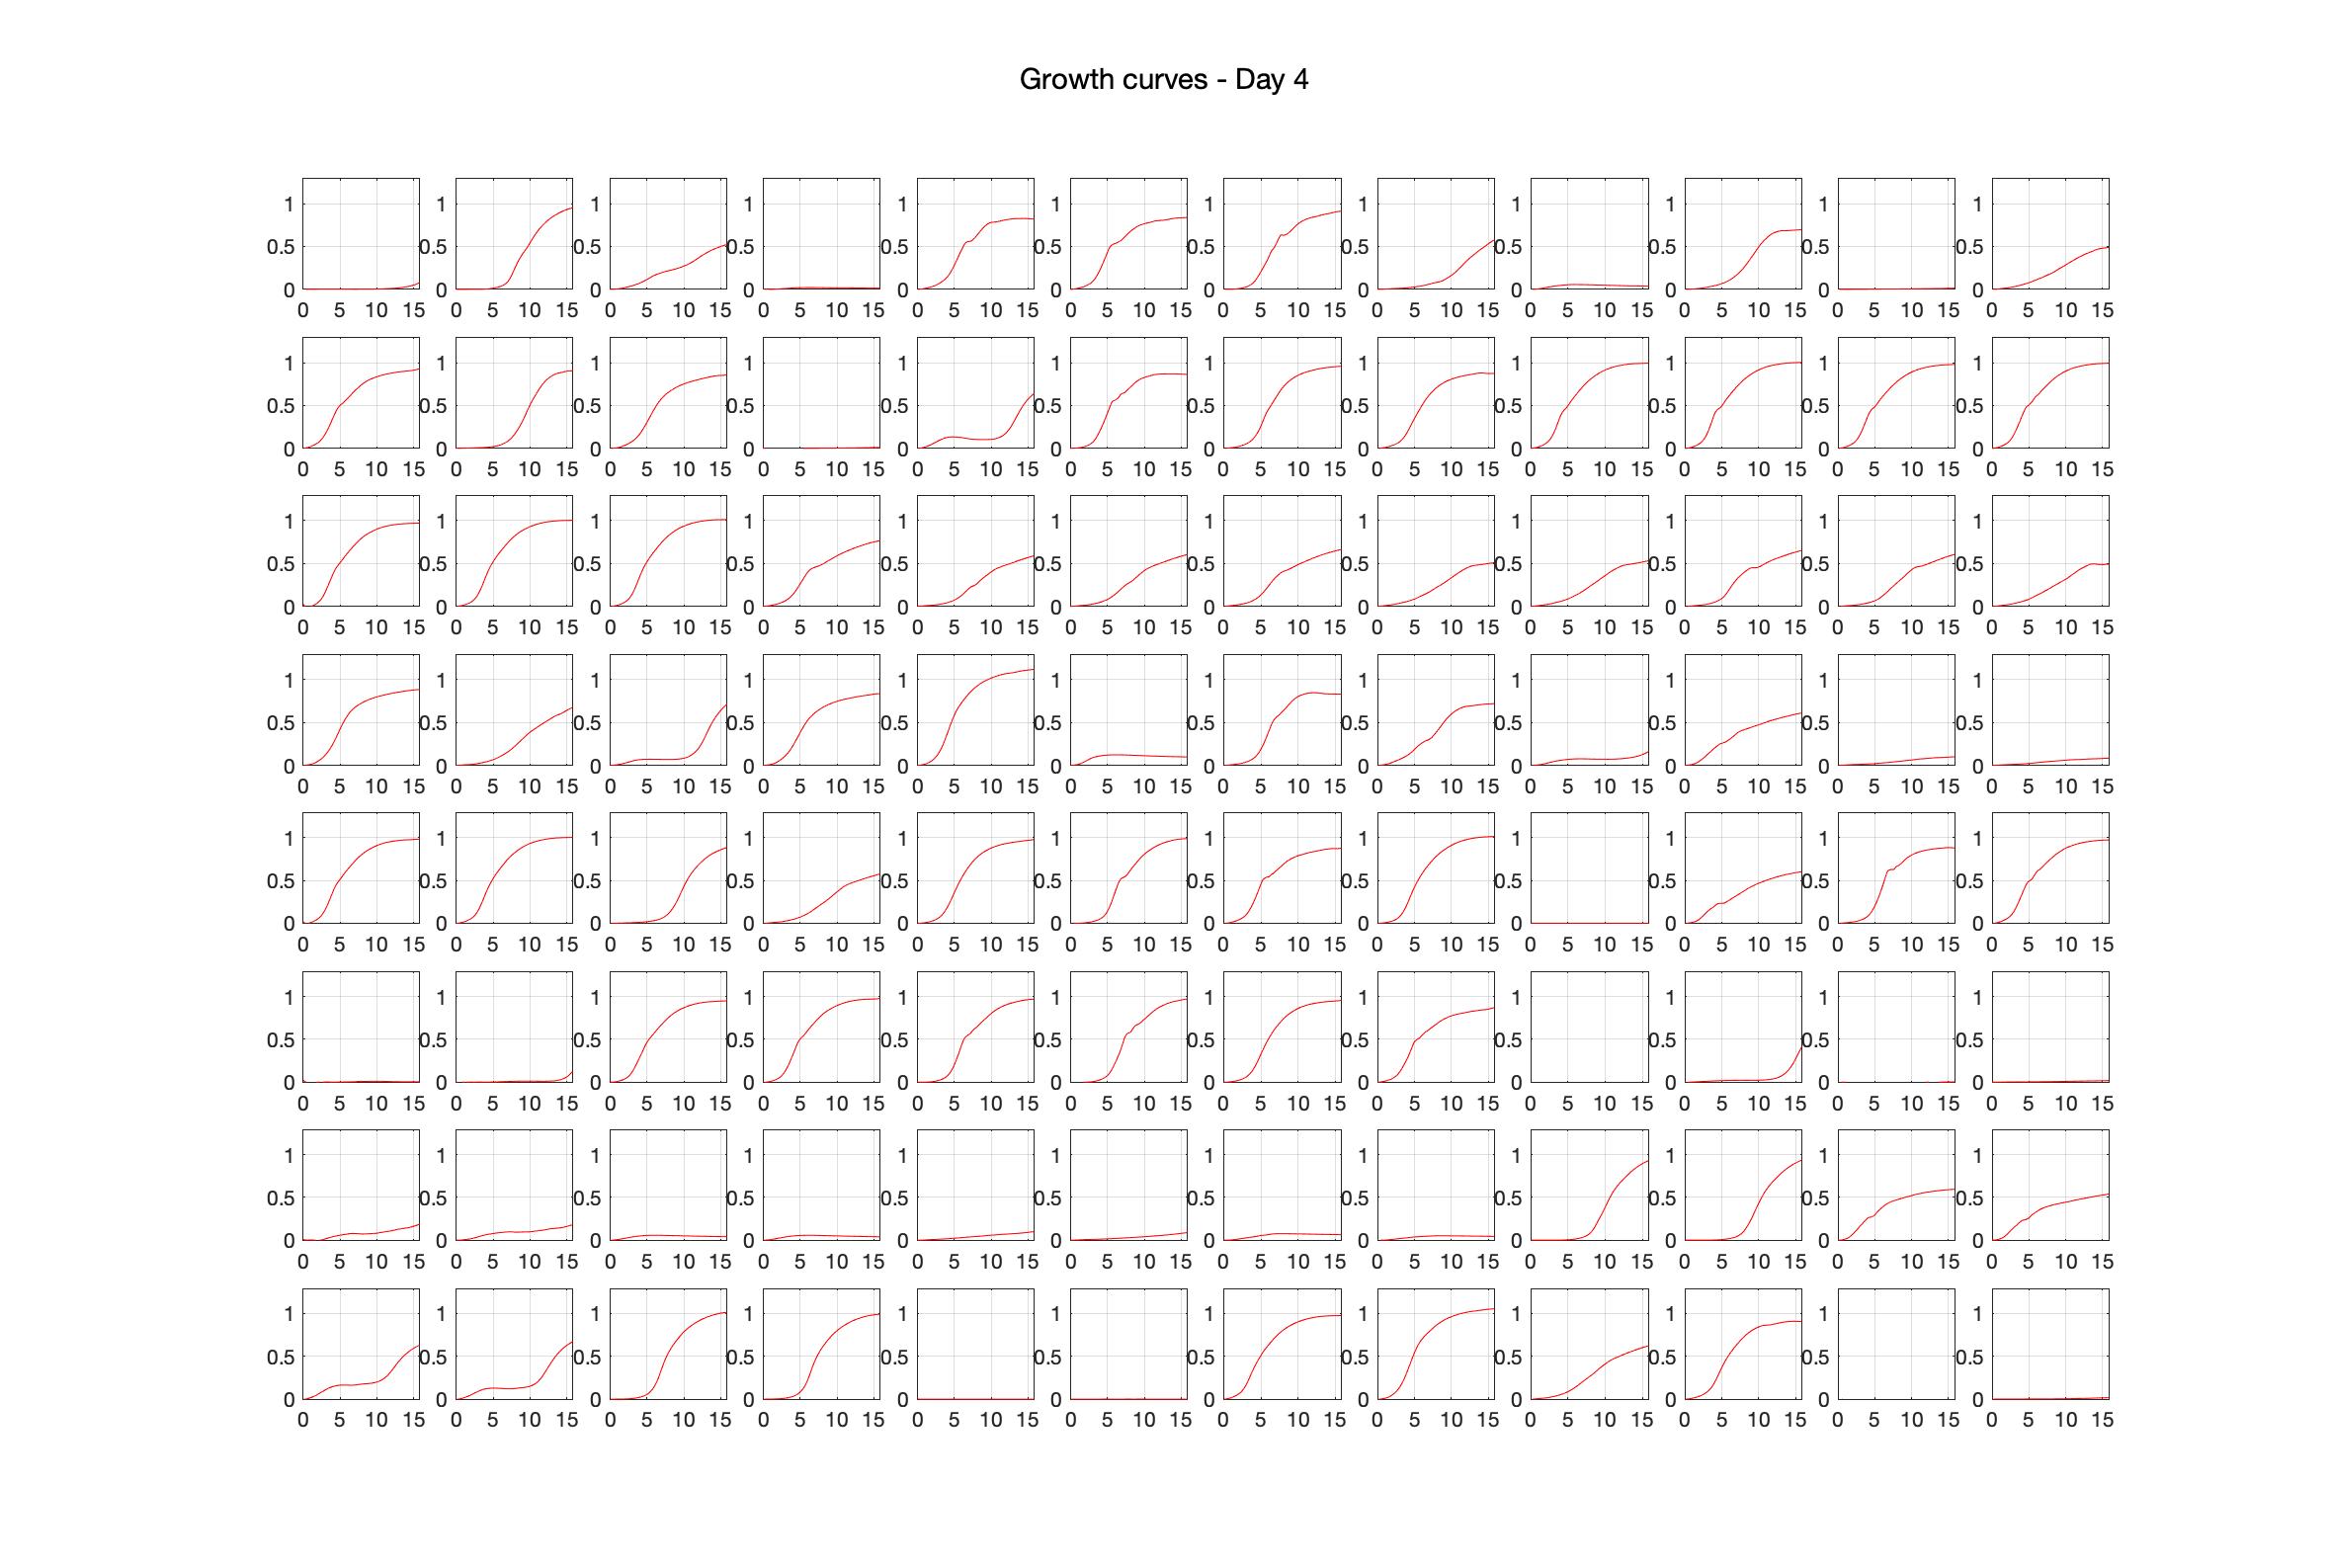
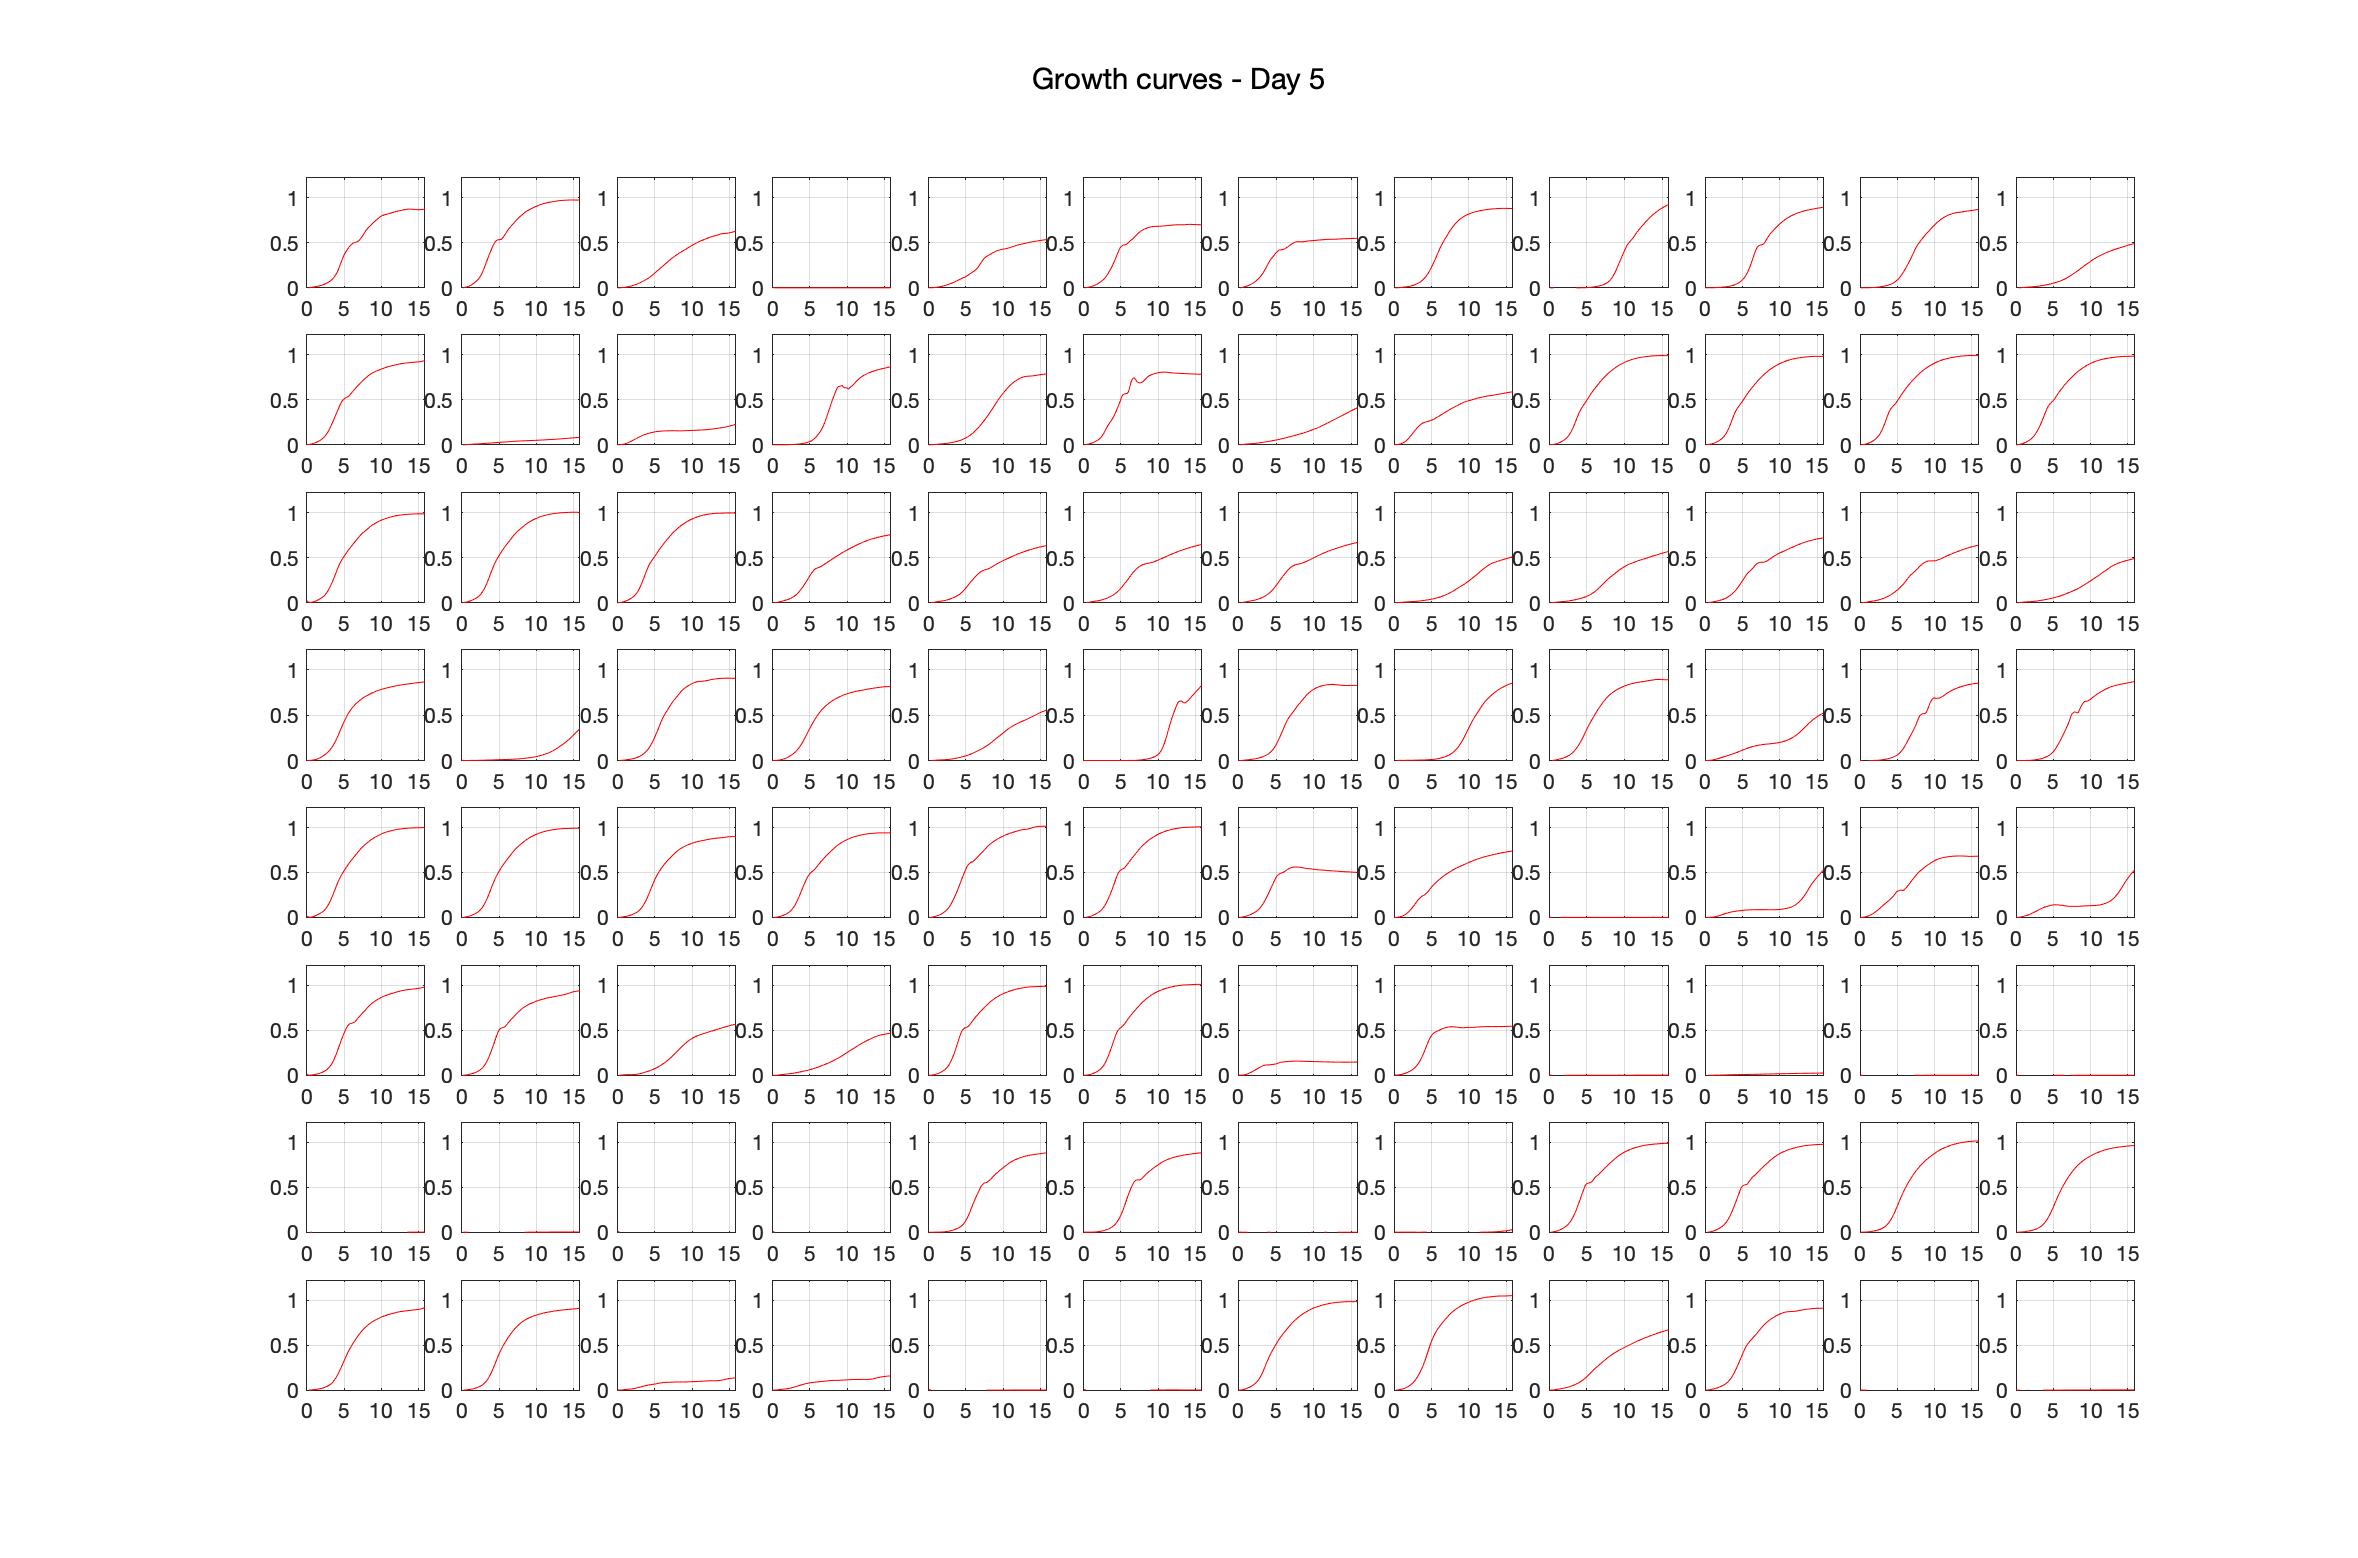
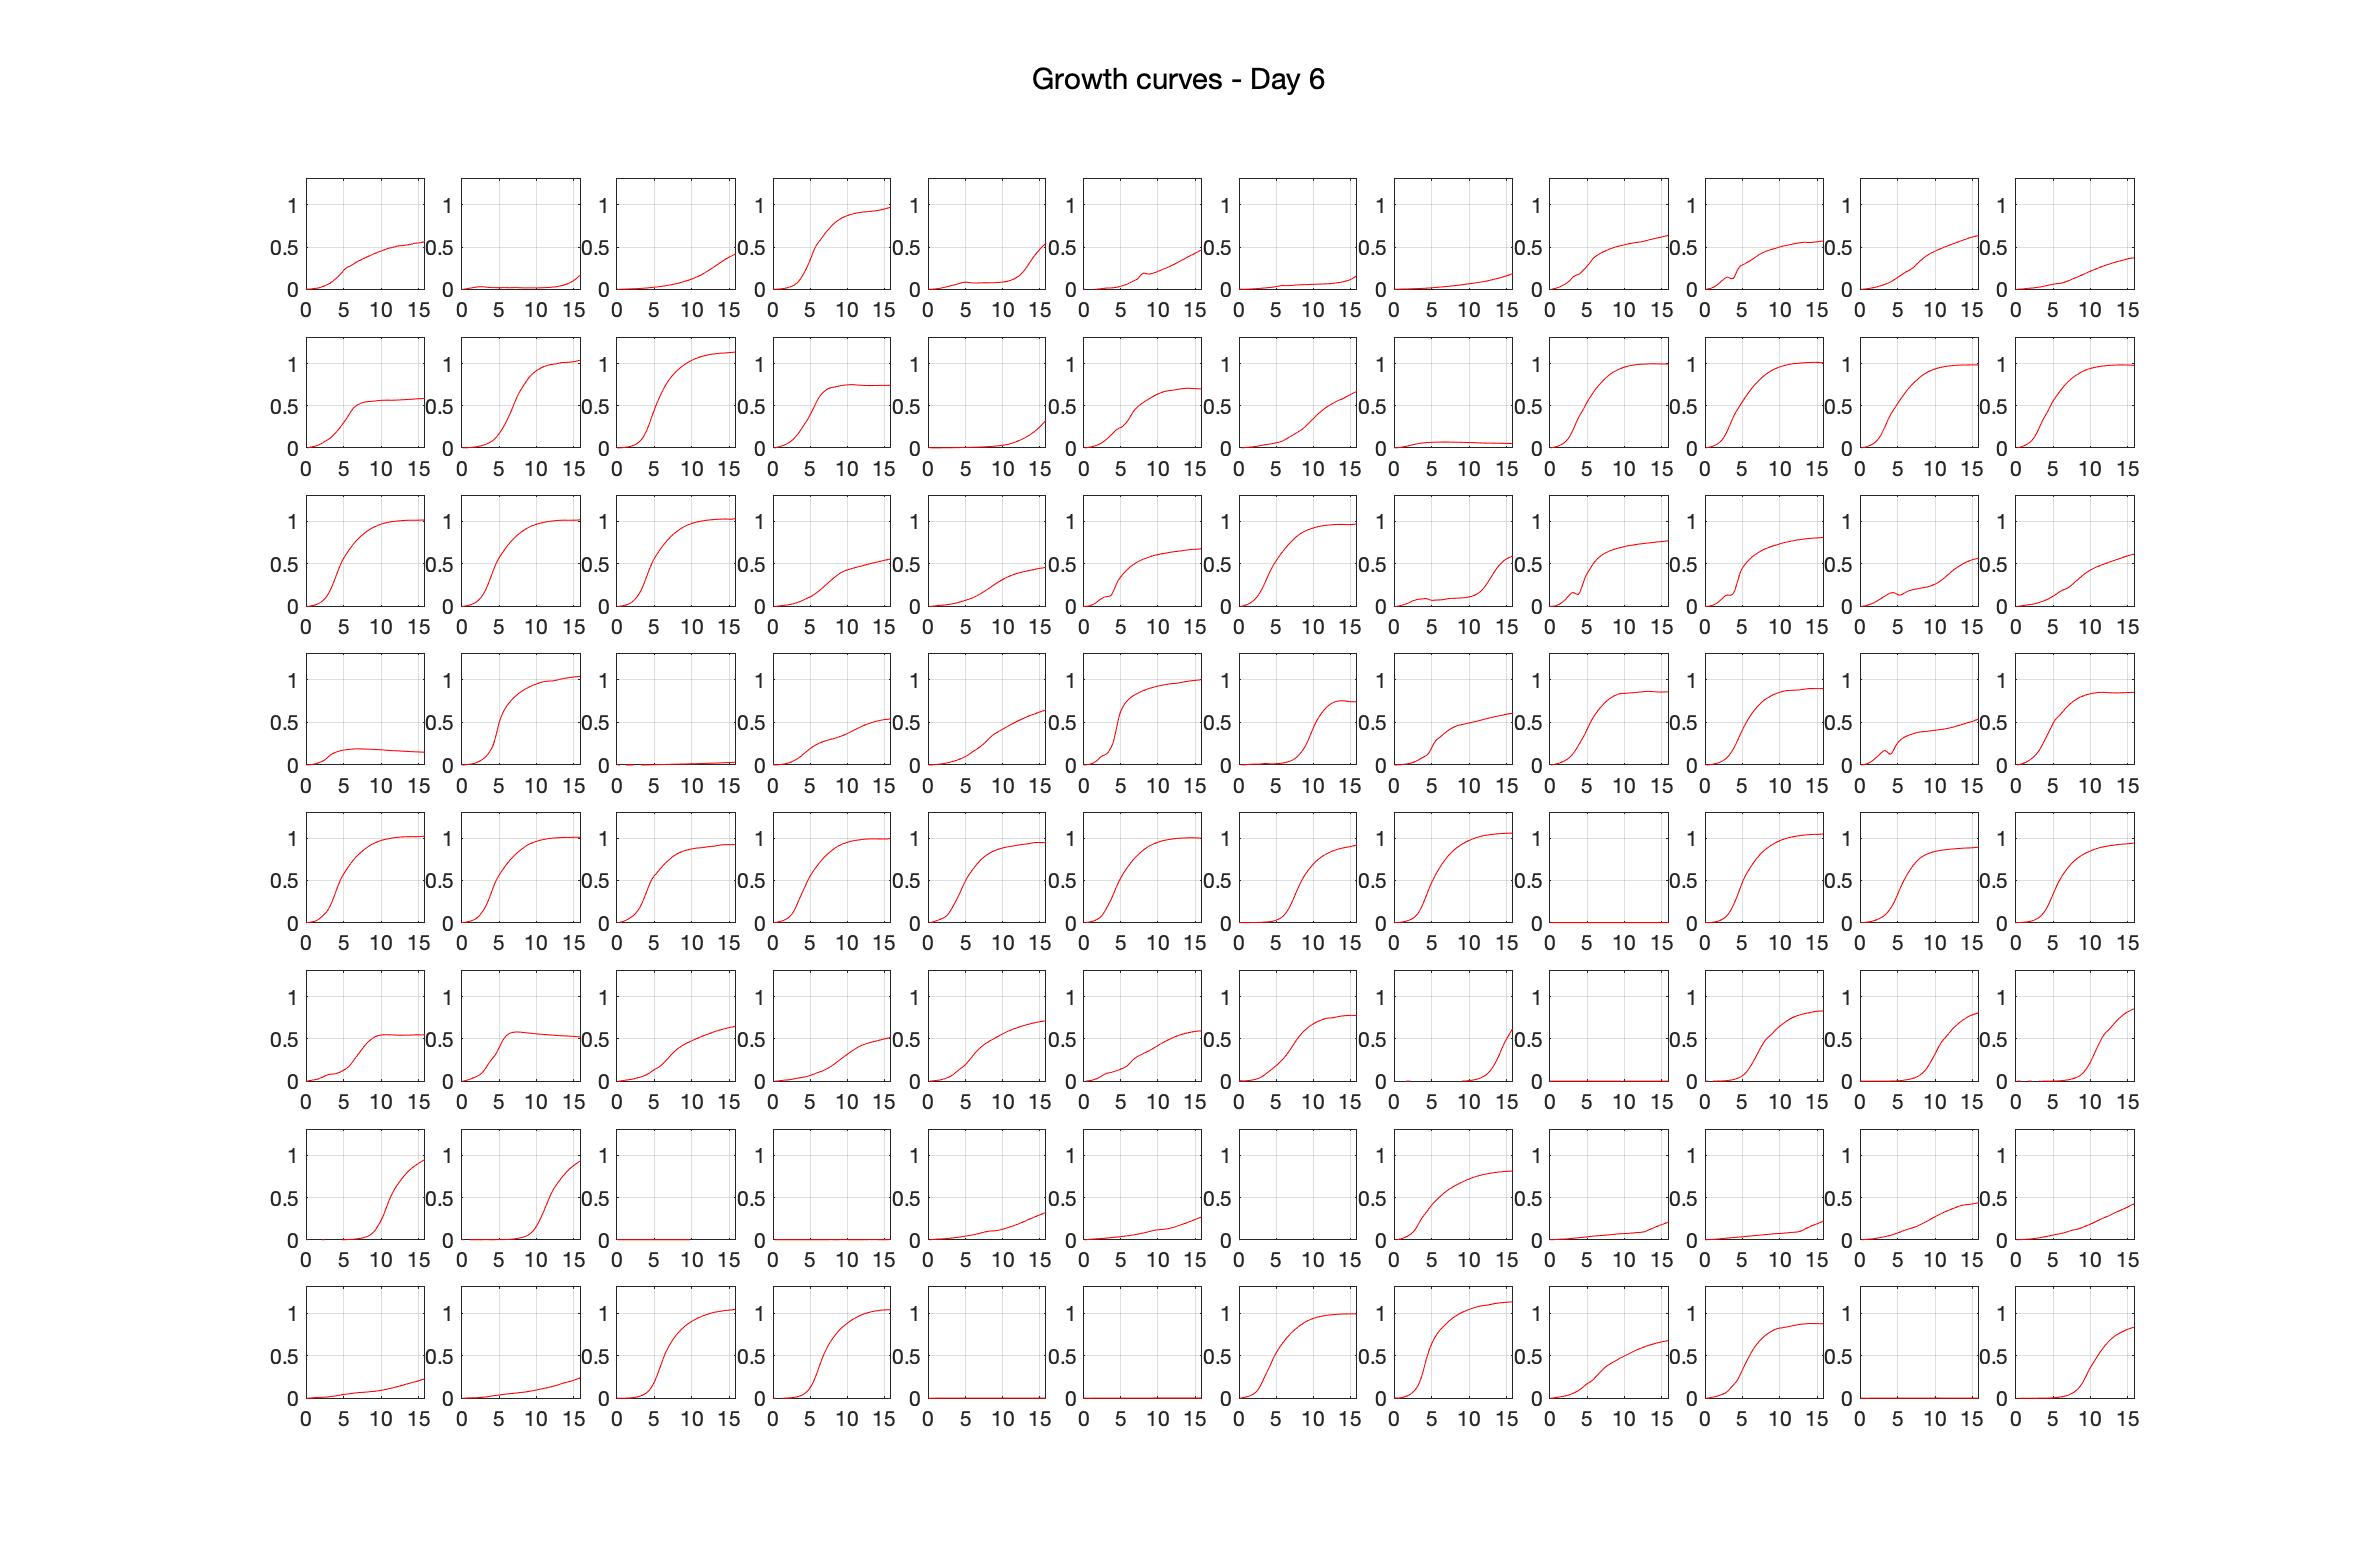
Daily Choice forms
The drug dosing regimen appears below and can be updated by participating student classes (by 4pm Eastern Standard Time). The relative optical density calculated by the first 18hr of growth will be updated daily.
Evolved resistance
We calculated the changes in drug resistance by growing each evolved strain on a range of antibiotic concentrations and calculating the changes in EC50 for each one of the drugs. Evolved lines chosen for targeted sequencing are marked by green frames.
Sequencing Results
Final project results include the minimal inhibitory concentrations, sequencing of selected genes, and full genome sequence of the winning super-bug.Sanger sequencing:
We used targeted sequencing to identify mutations in three genes previously associated with antibiotics resistance: gyrE, fusE, acrB. The genes were only sequenced in a subset of evolved strains the were identified as drug resistance (see above). All sequences can be downloaded from HERE.