Emerging levels of drug resistance
We systematically measured the ability of each evolved strain to grow a range of antibiotic concentrations. The graph depicts drug resistance observed each evolved strains relative to the ancestor strain (normalized resistance).
- Normalized resistance of 0 indicates no change in antibiotics resistance during evolution.
- Positive values indicate increased resistance (a value of 1 indicate the highest resistance observed across all strains).
- Negative values indicate decreased resistance - the evolved strain become drug sensitive.
- Evolved strains characterized by multi-drug resistance are framed in green.
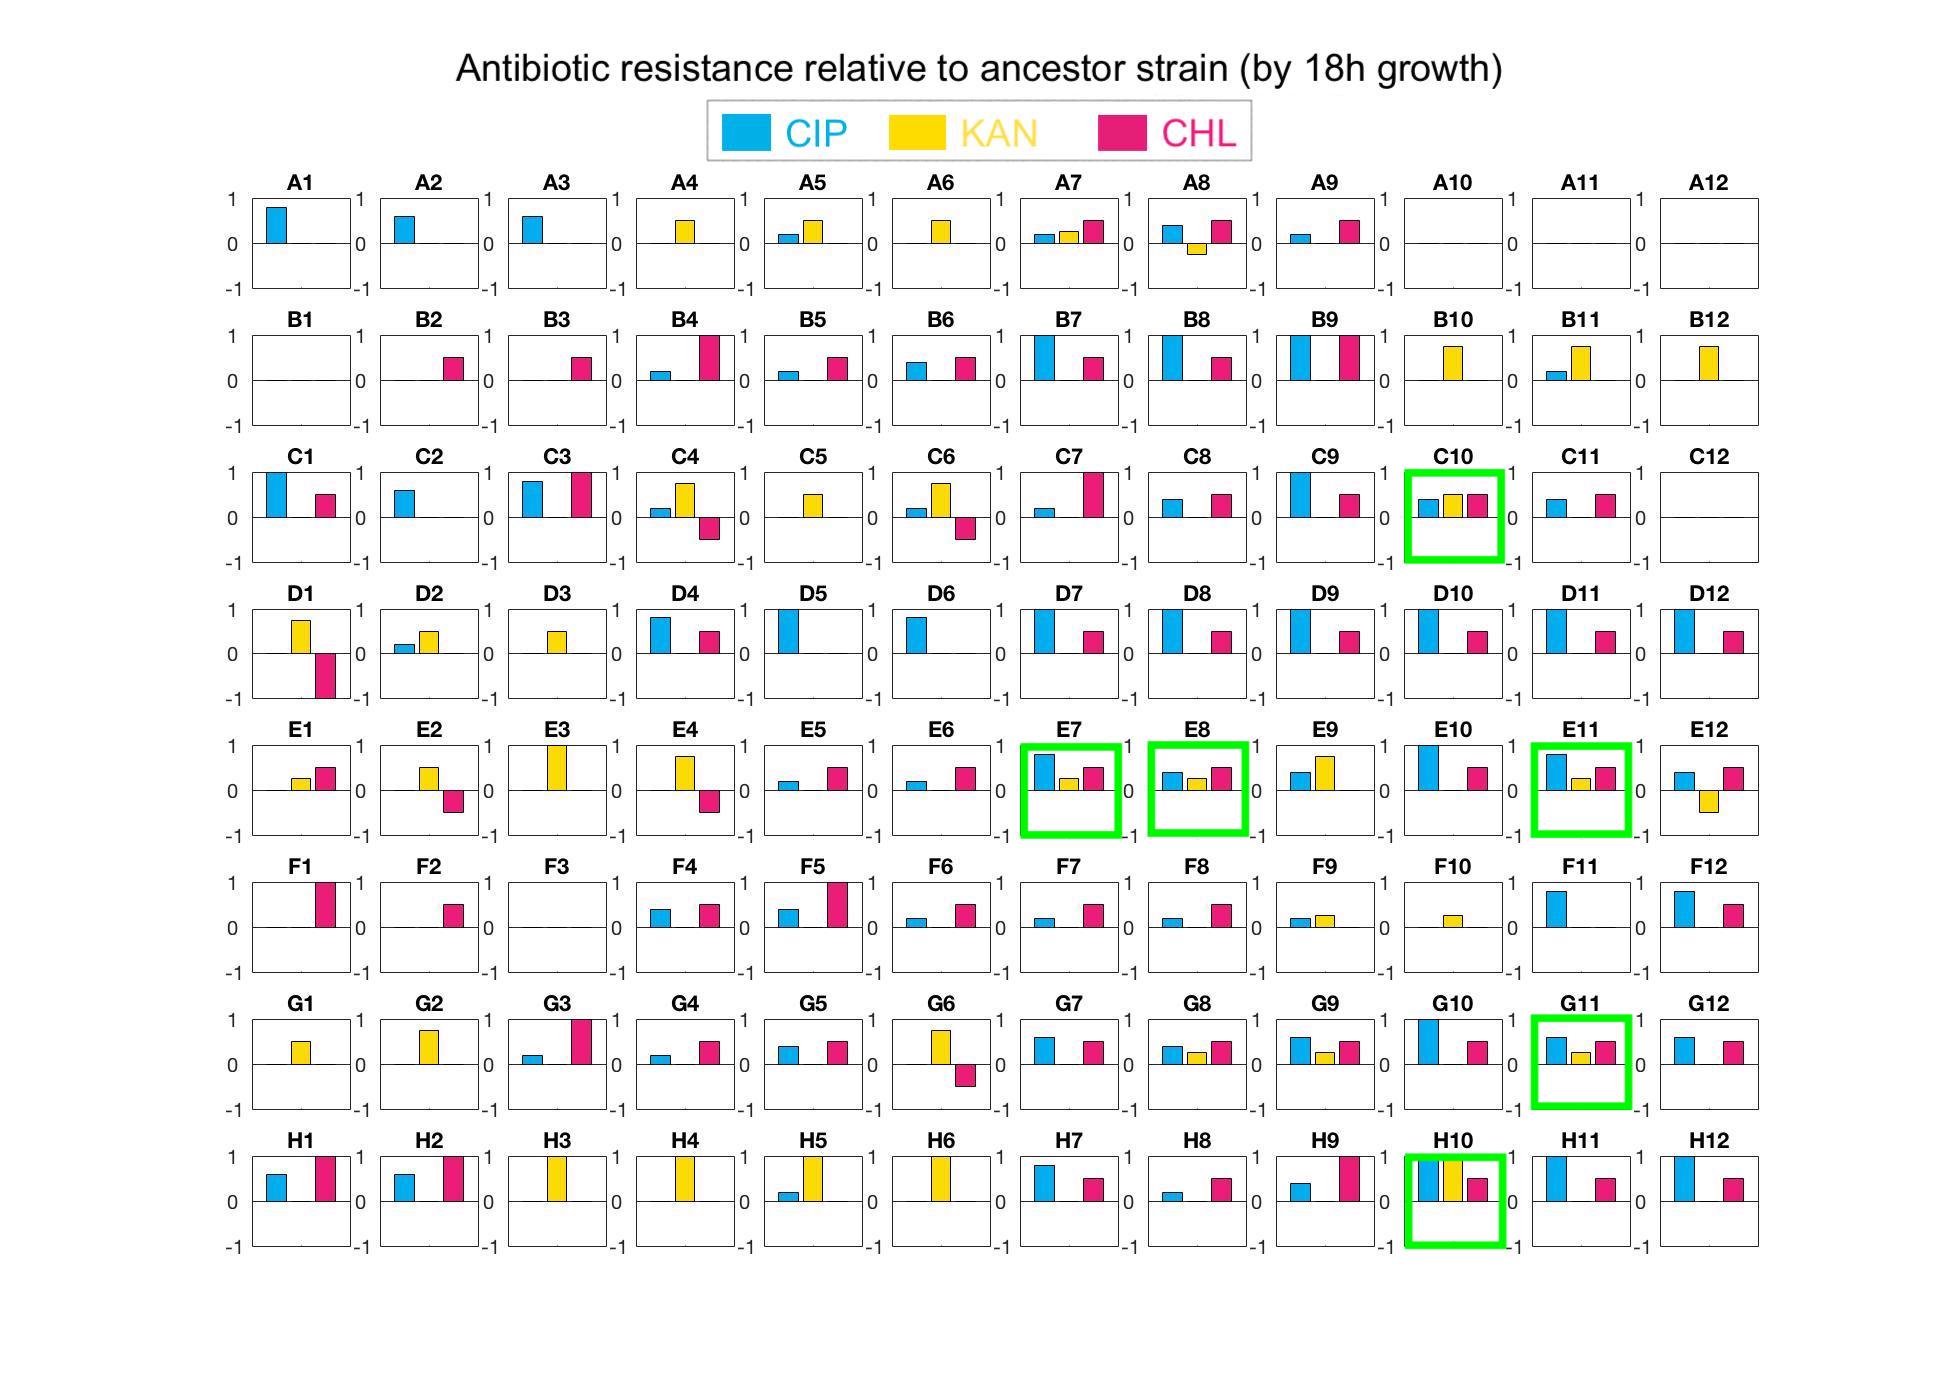
Levels of drug resistance relative to the ancestor strain. Wells marked in green a suspected as multi-drug resistant strains.
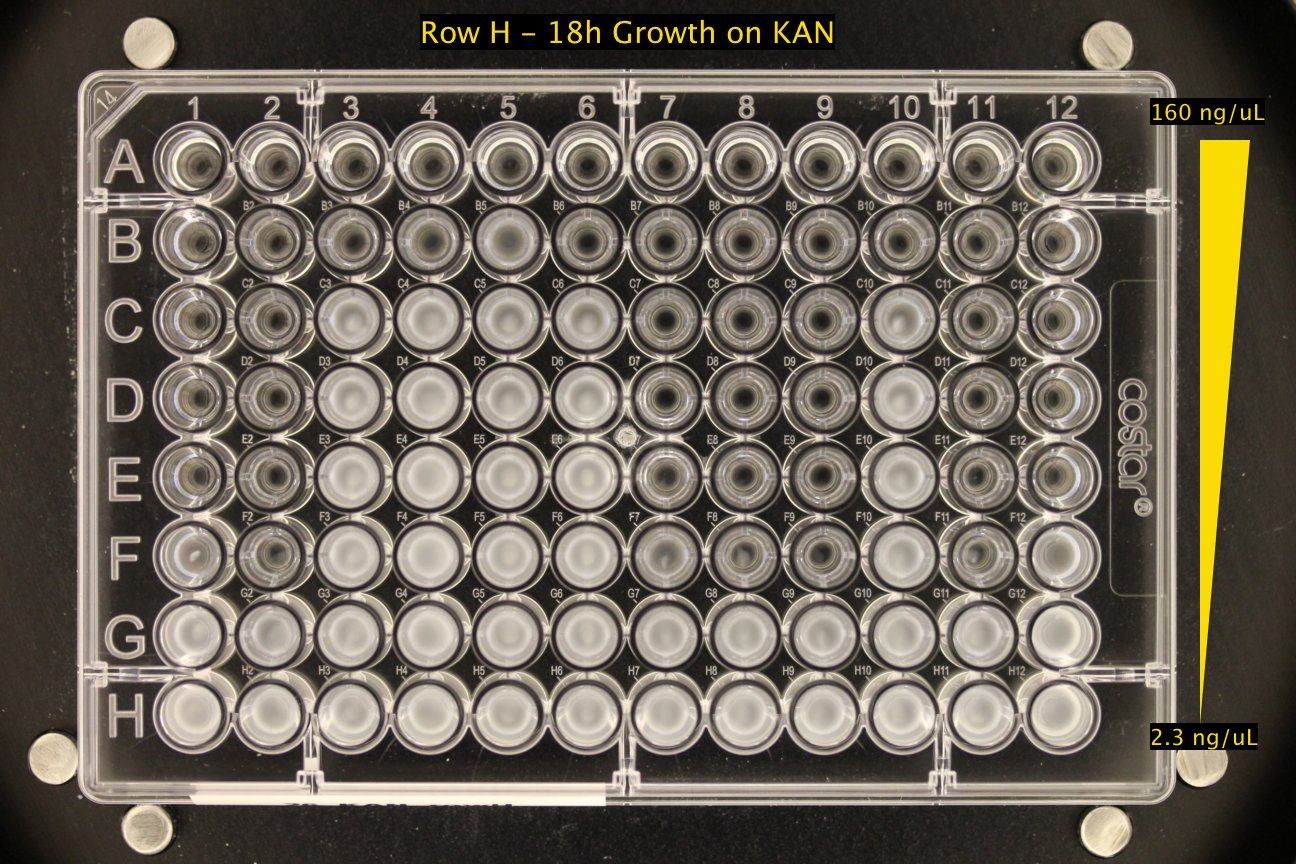
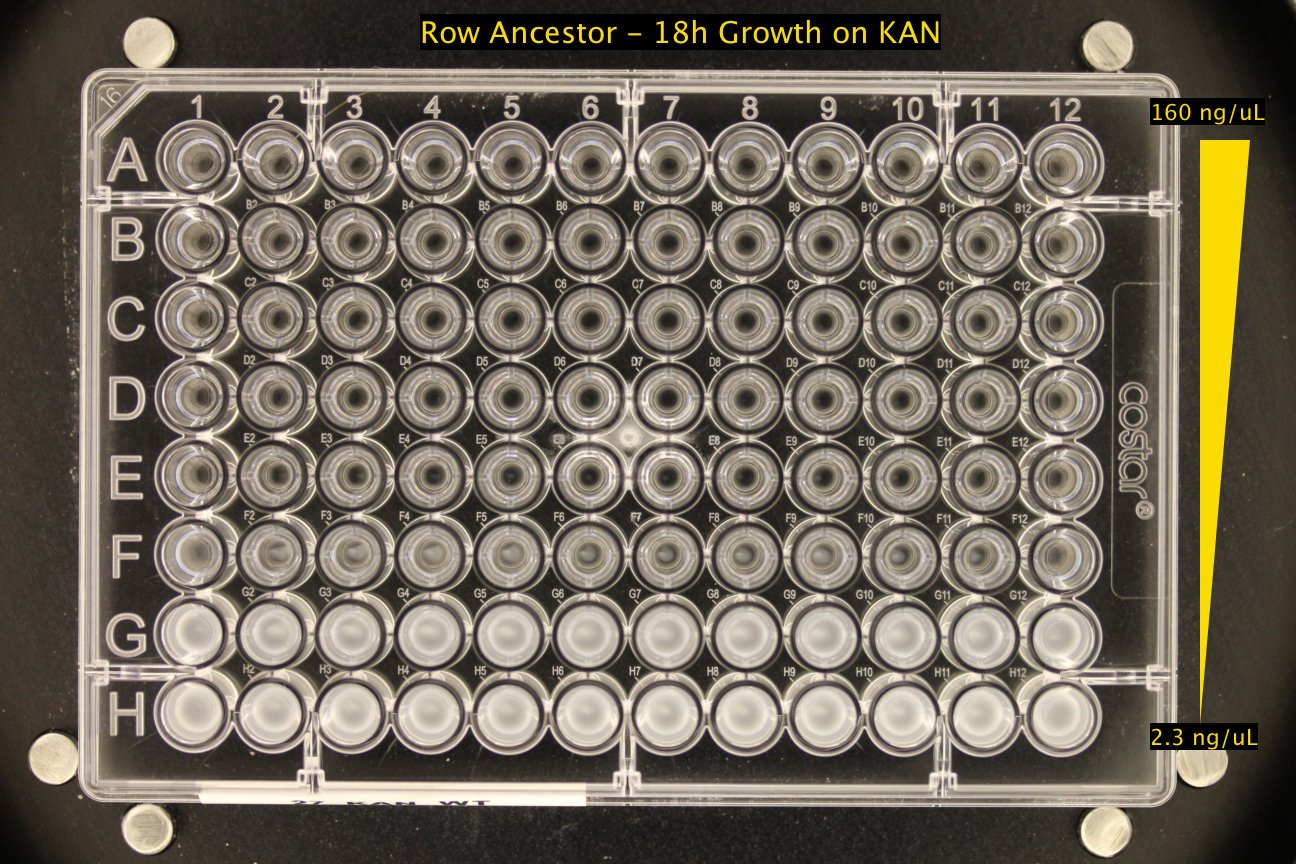
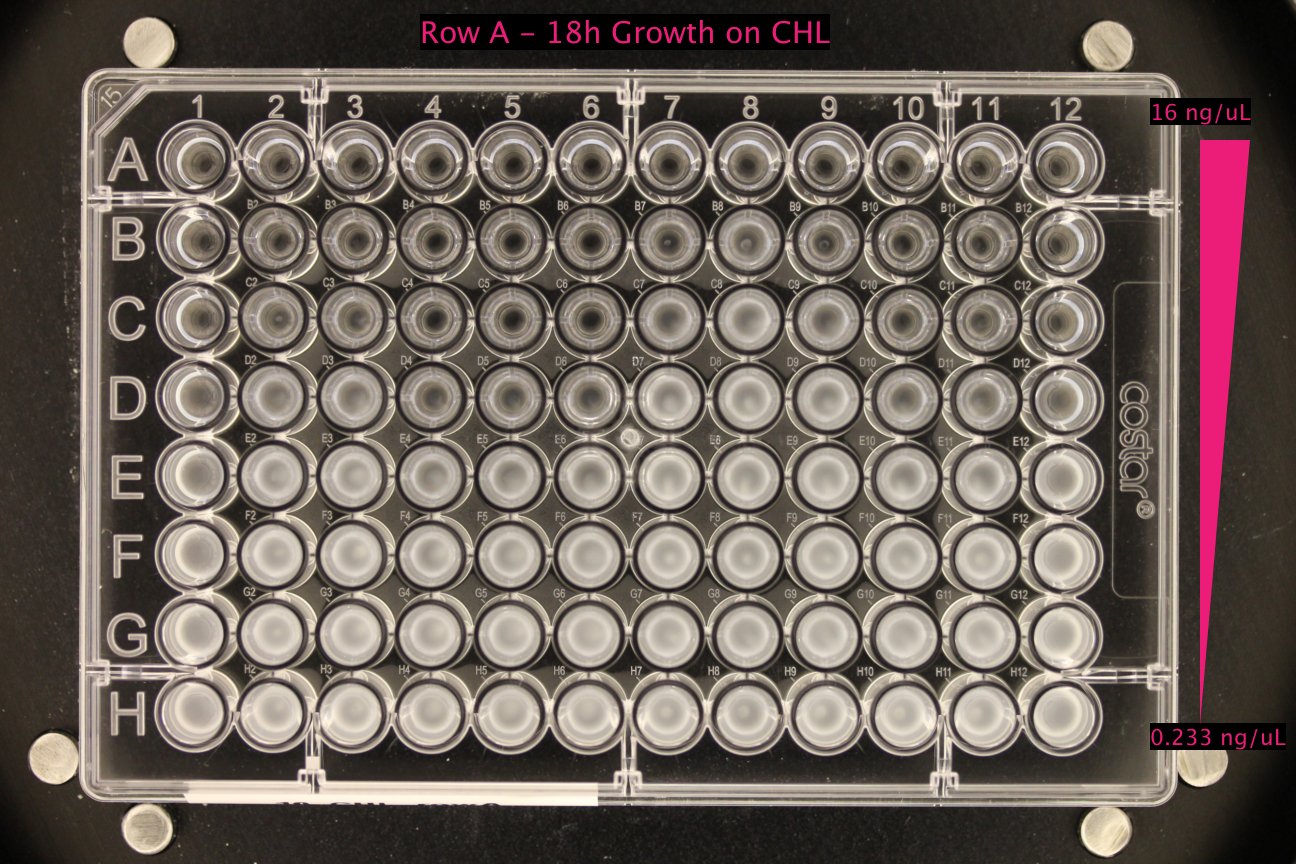
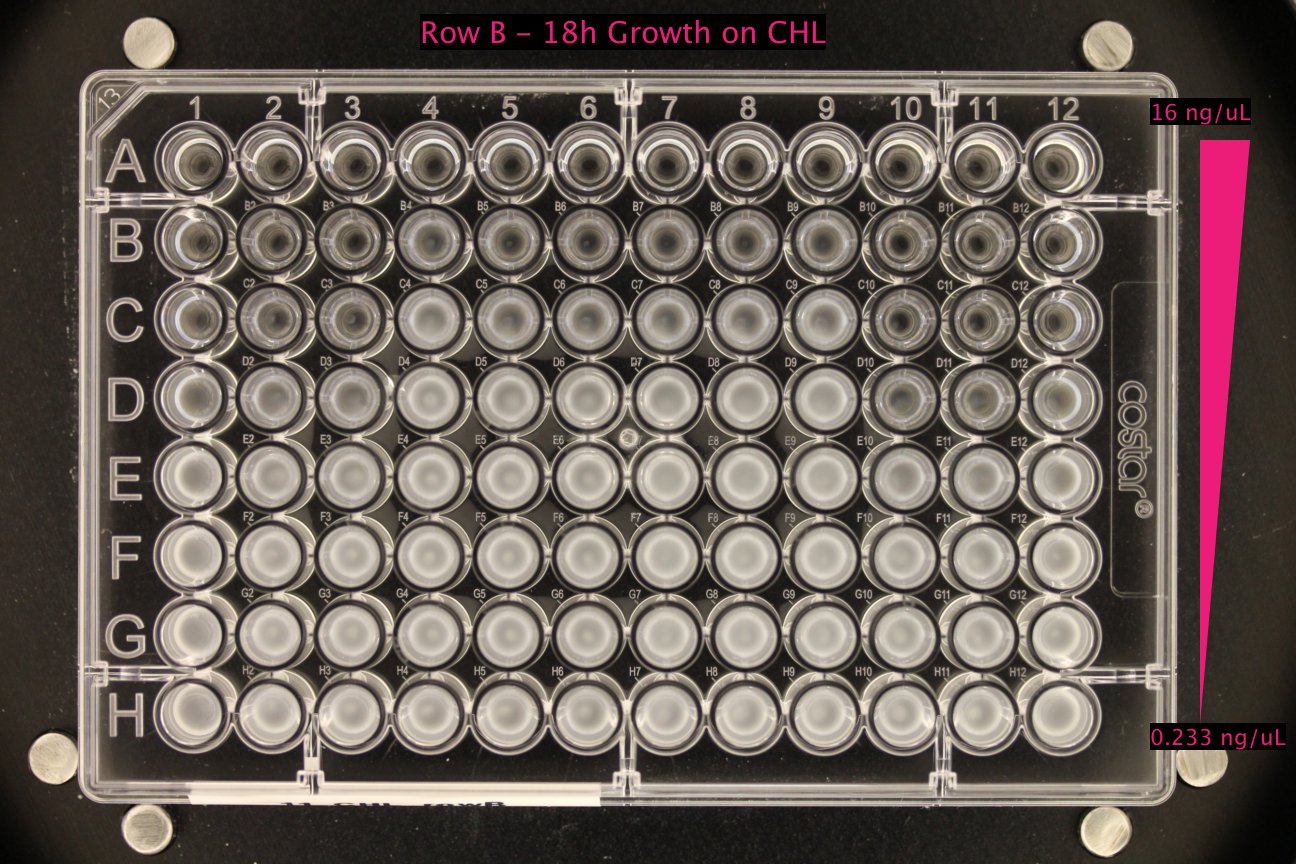
Testing individual colonies for multi-drug resistance
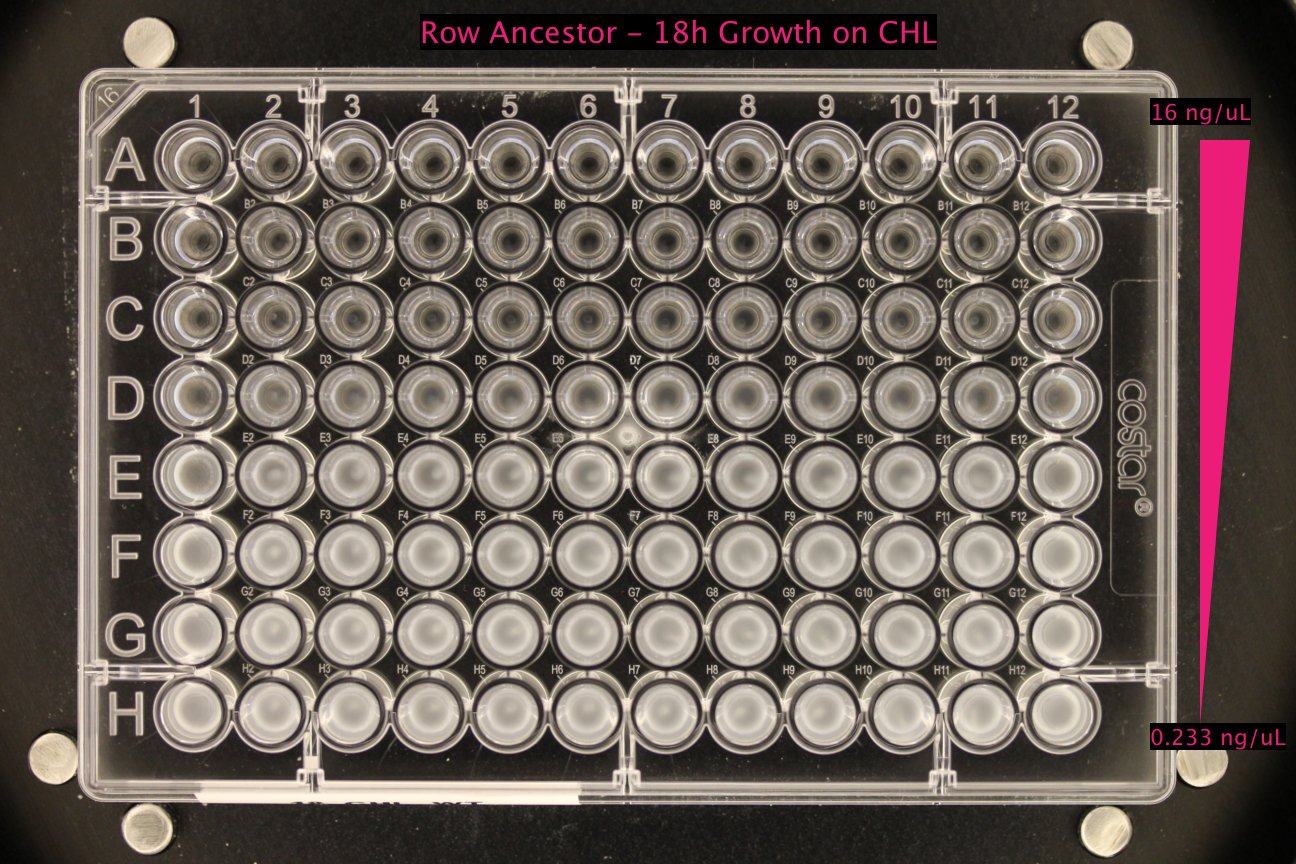
In order examine evolved strains for multi-drug resistance, we inoculated these strains on agar plates and grew isolated colonies (each originating from a single cell). We tested the antibiotics resistance profile for 12 colonies from each well. Results in the last row depict the resistance measured for 12 colonies isolated from the ancestor wild-type strain (marked wt).

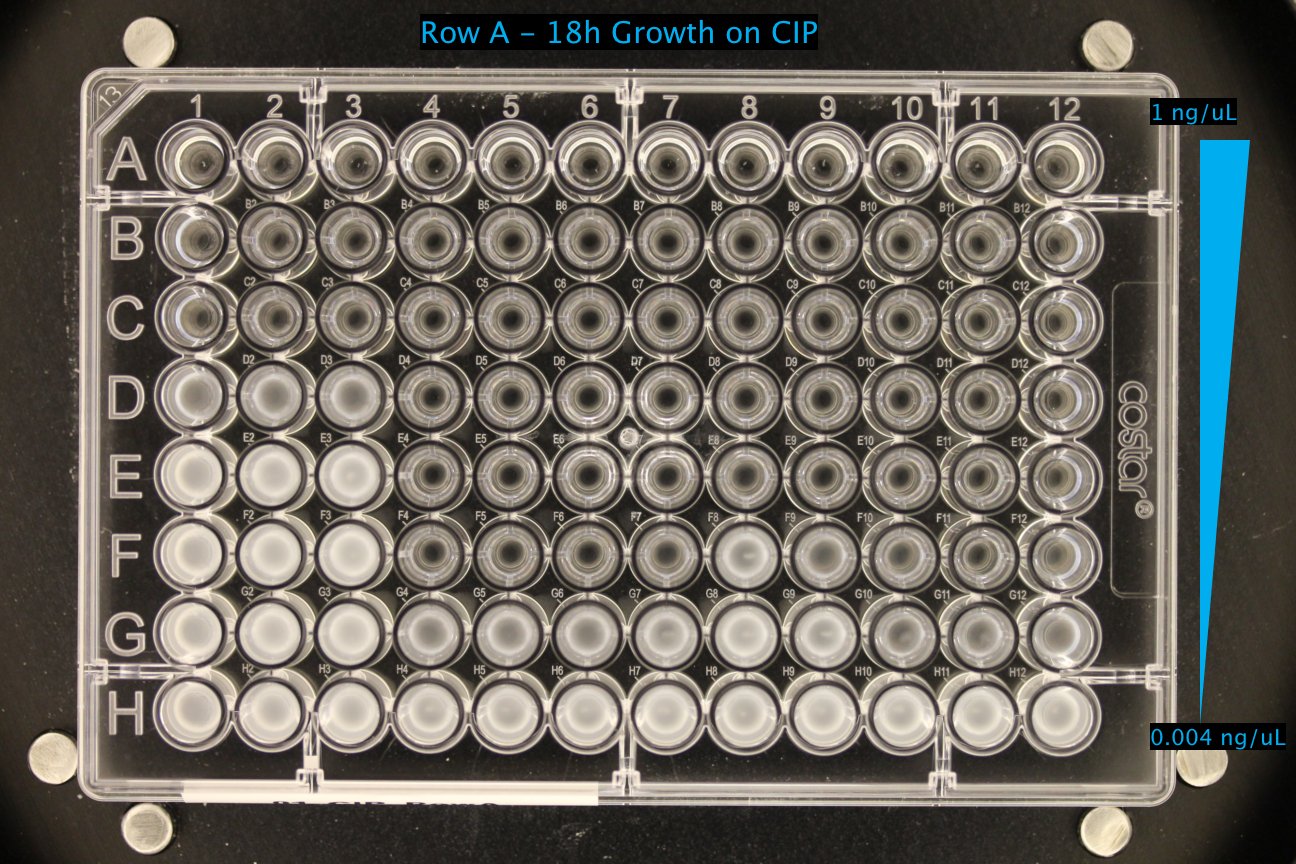
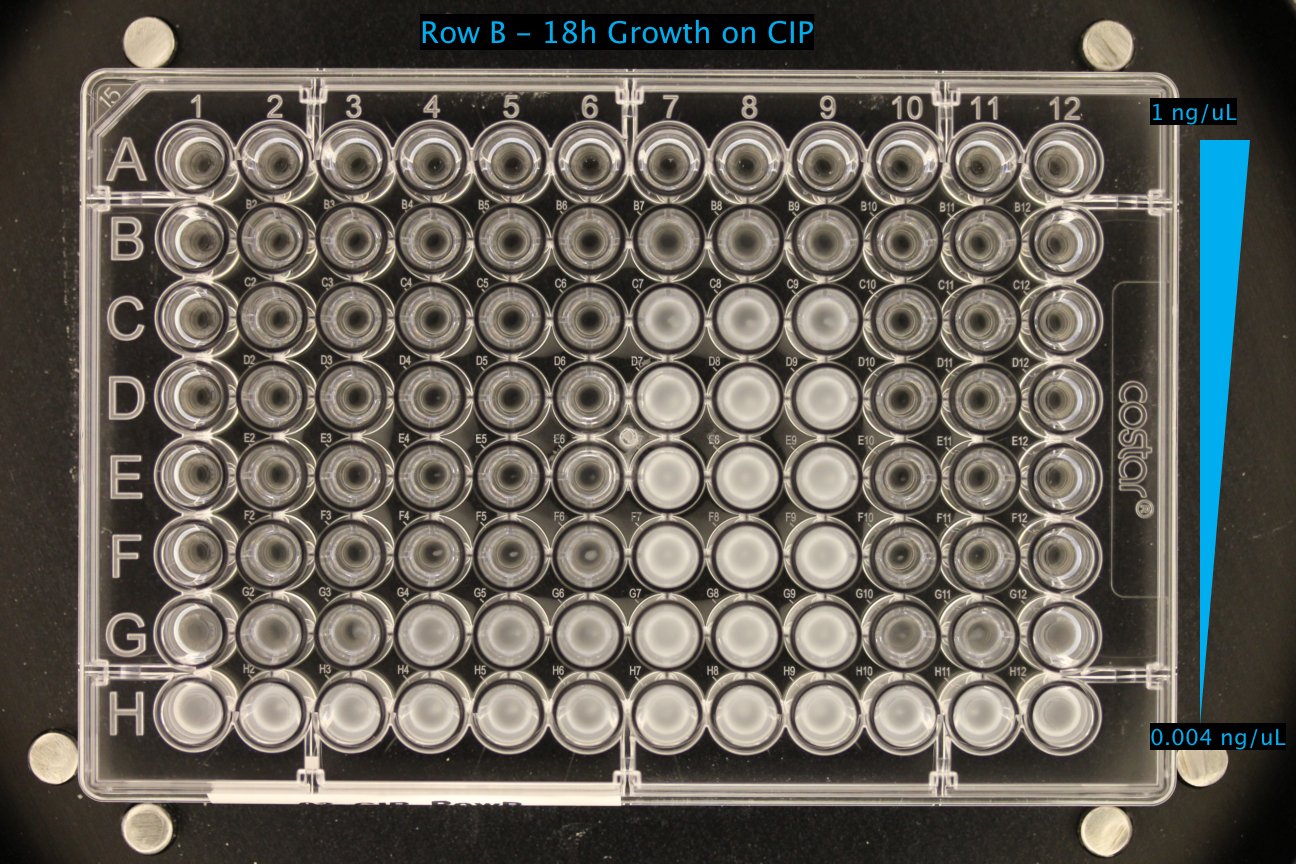
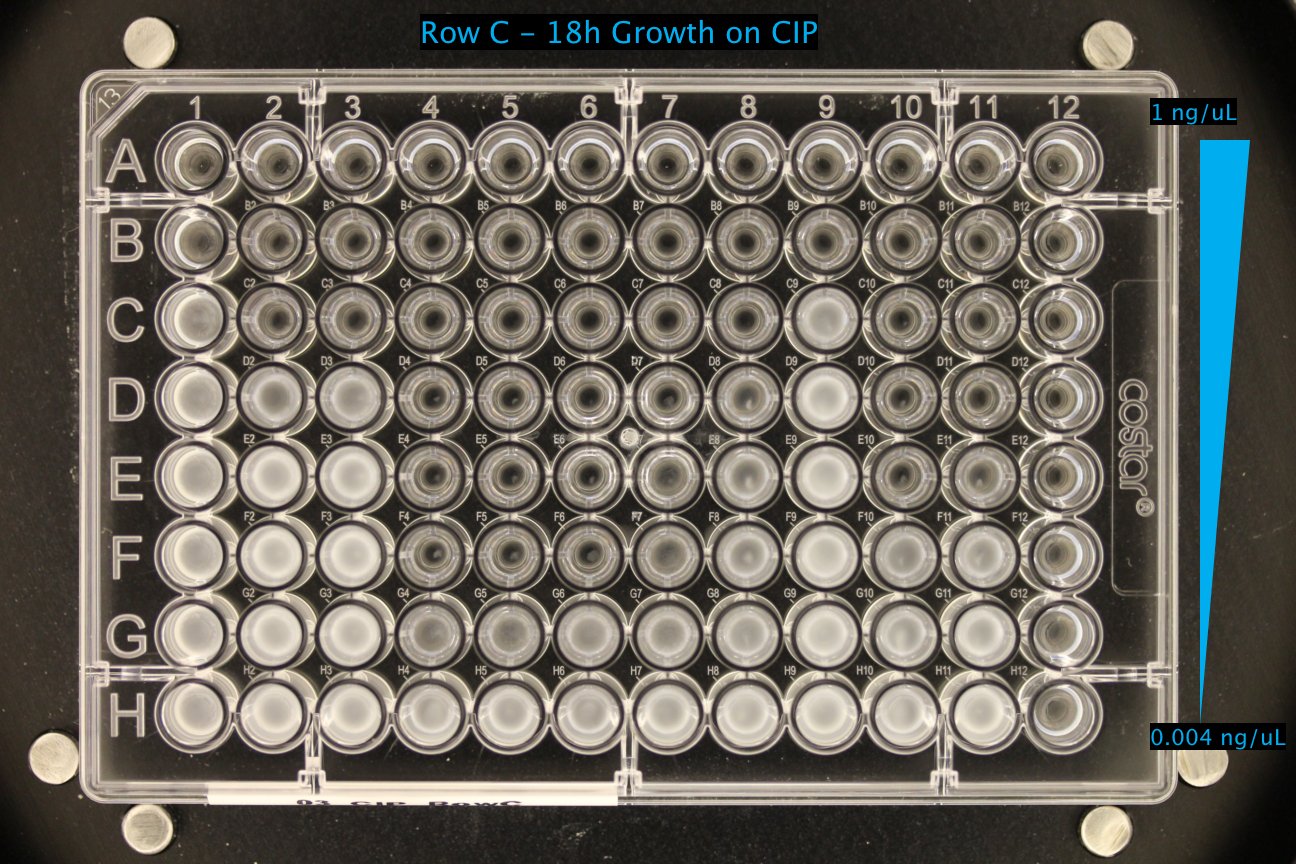
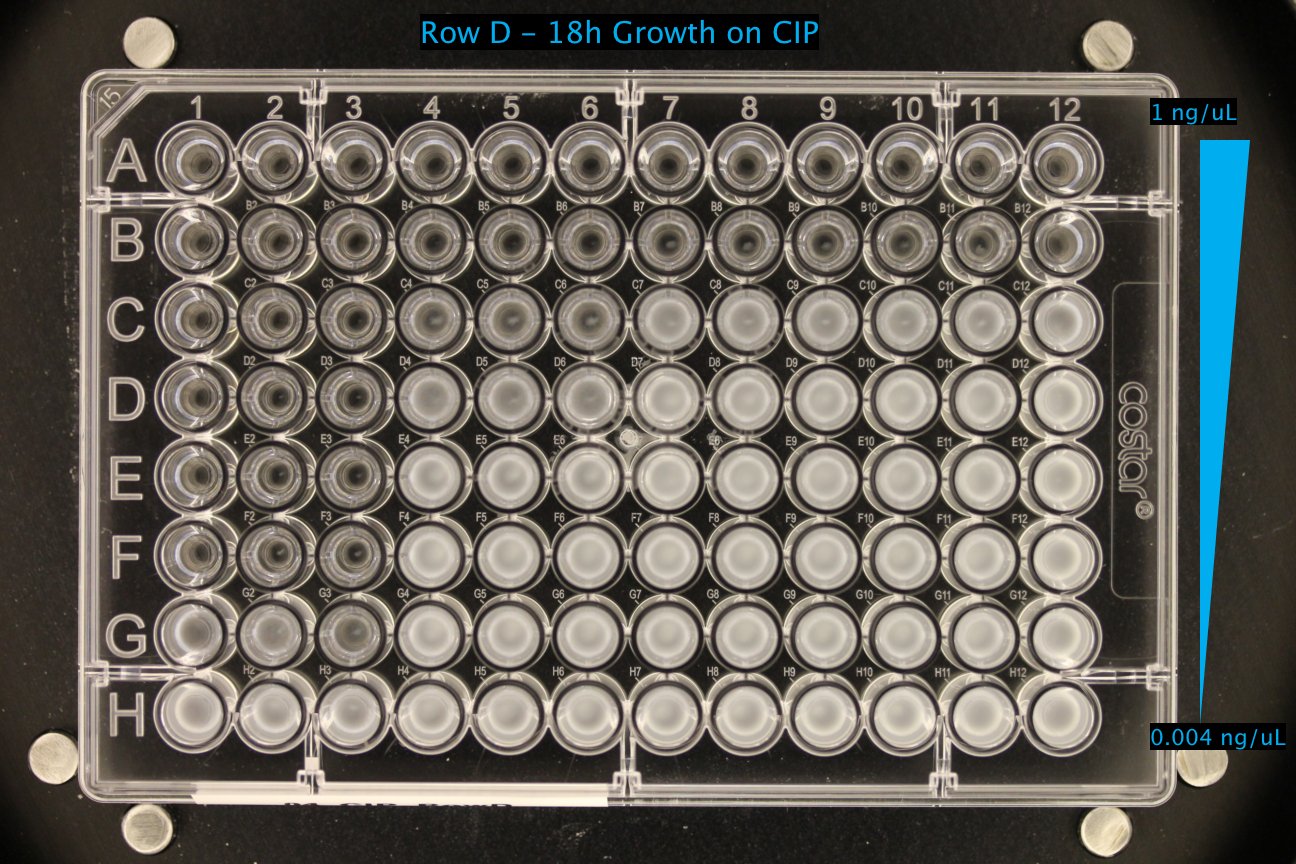
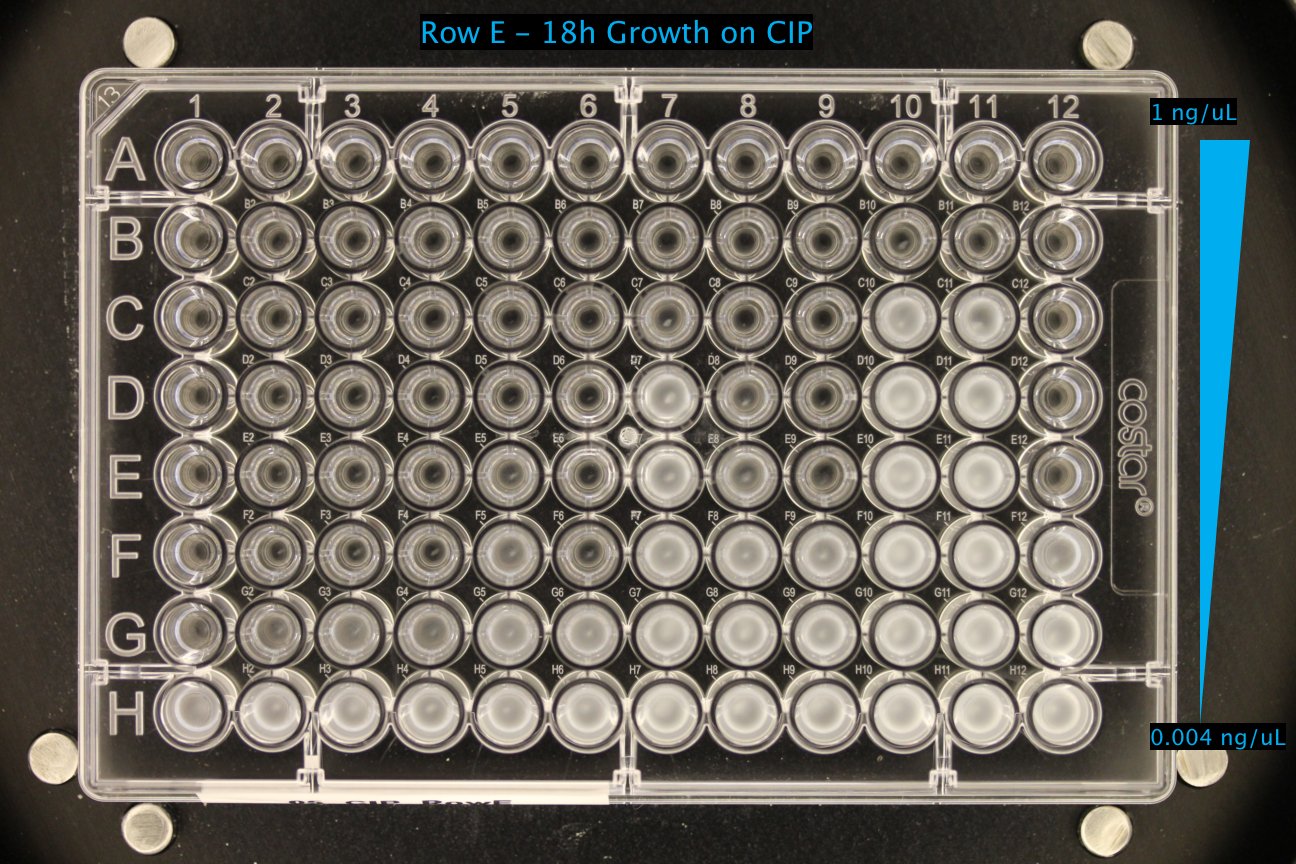
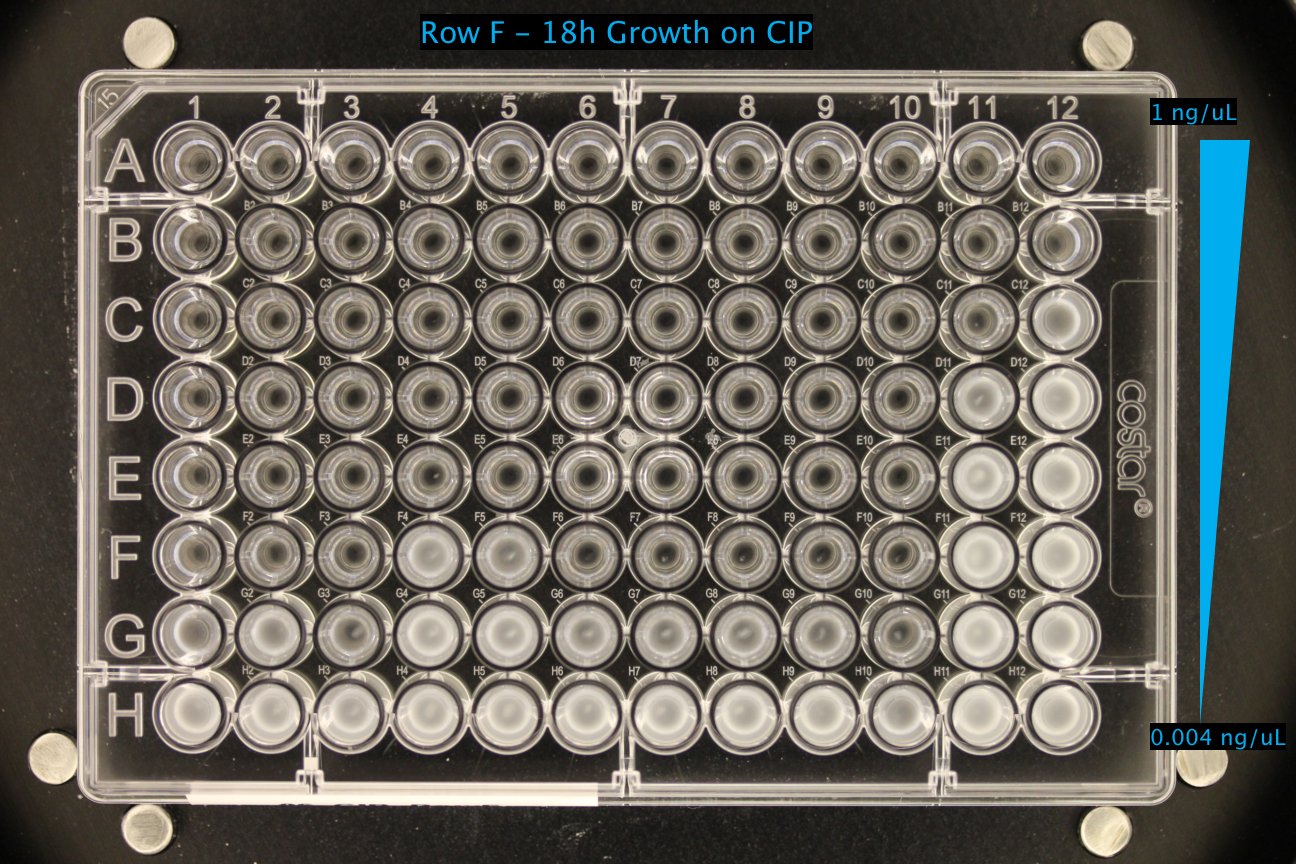
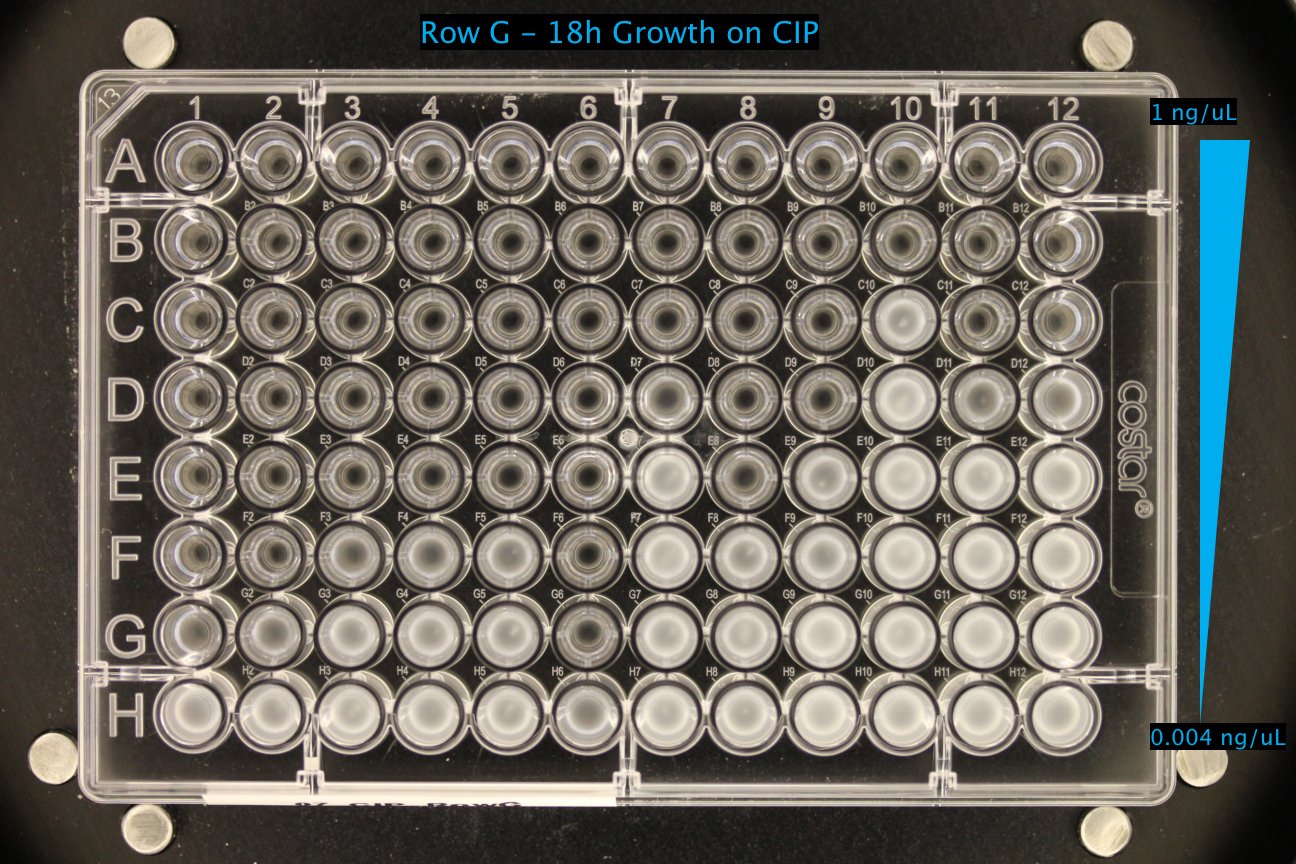
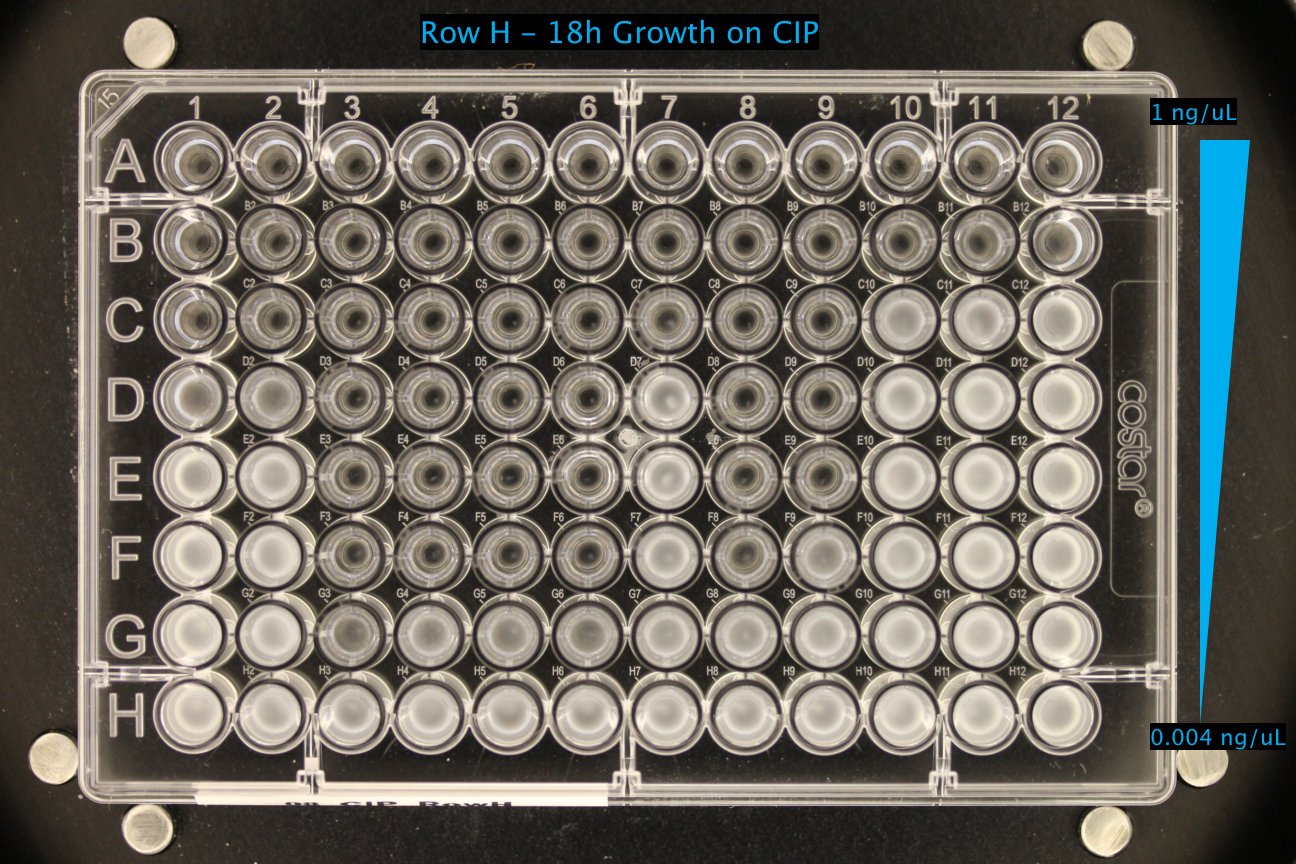
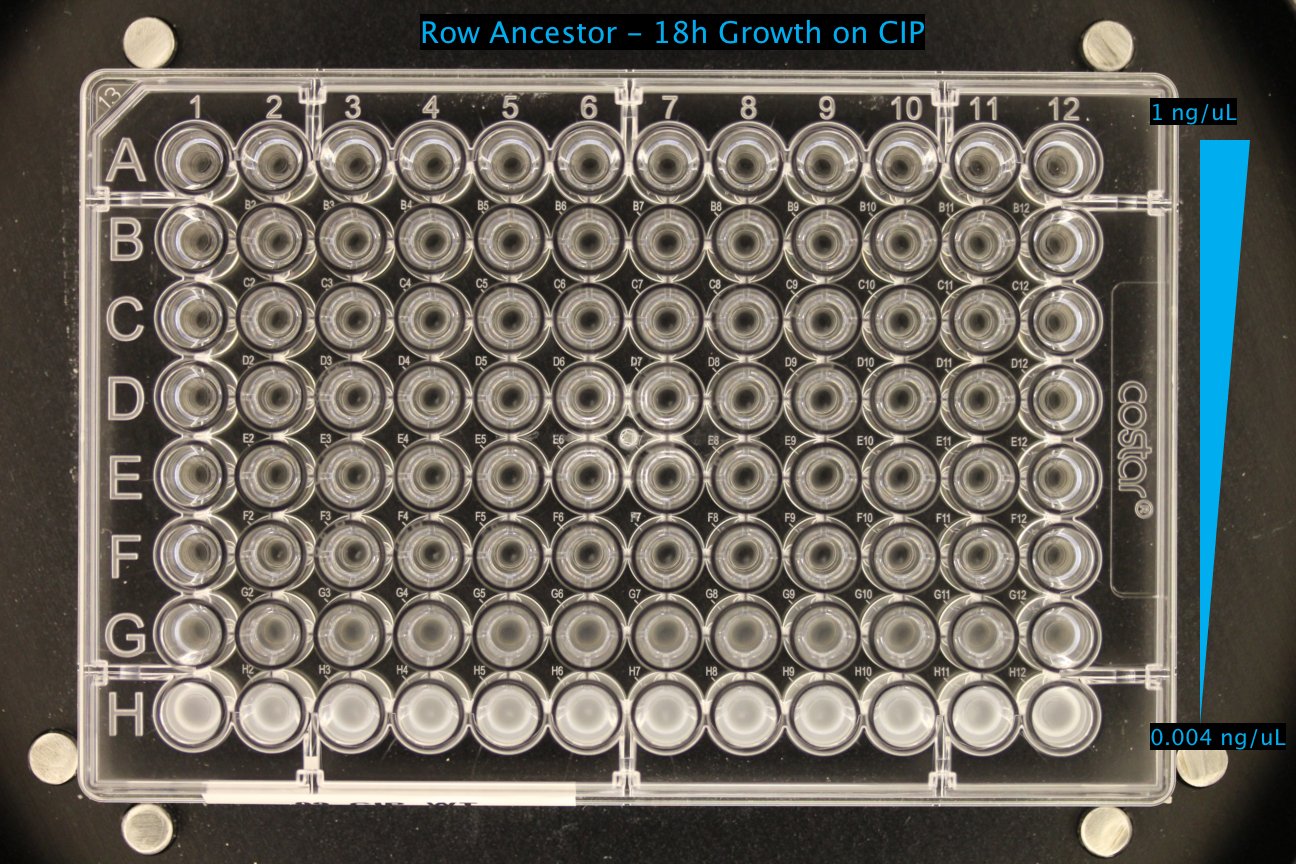
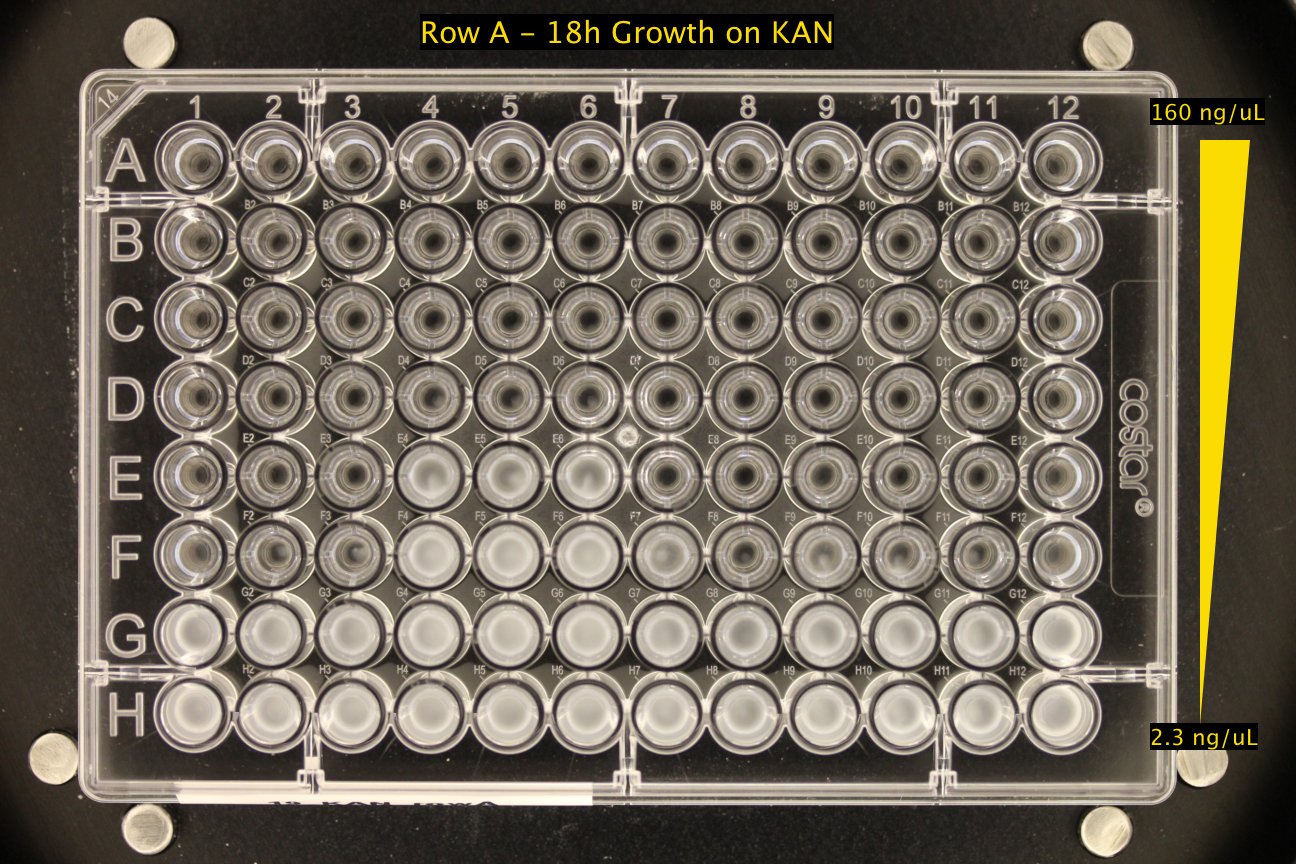
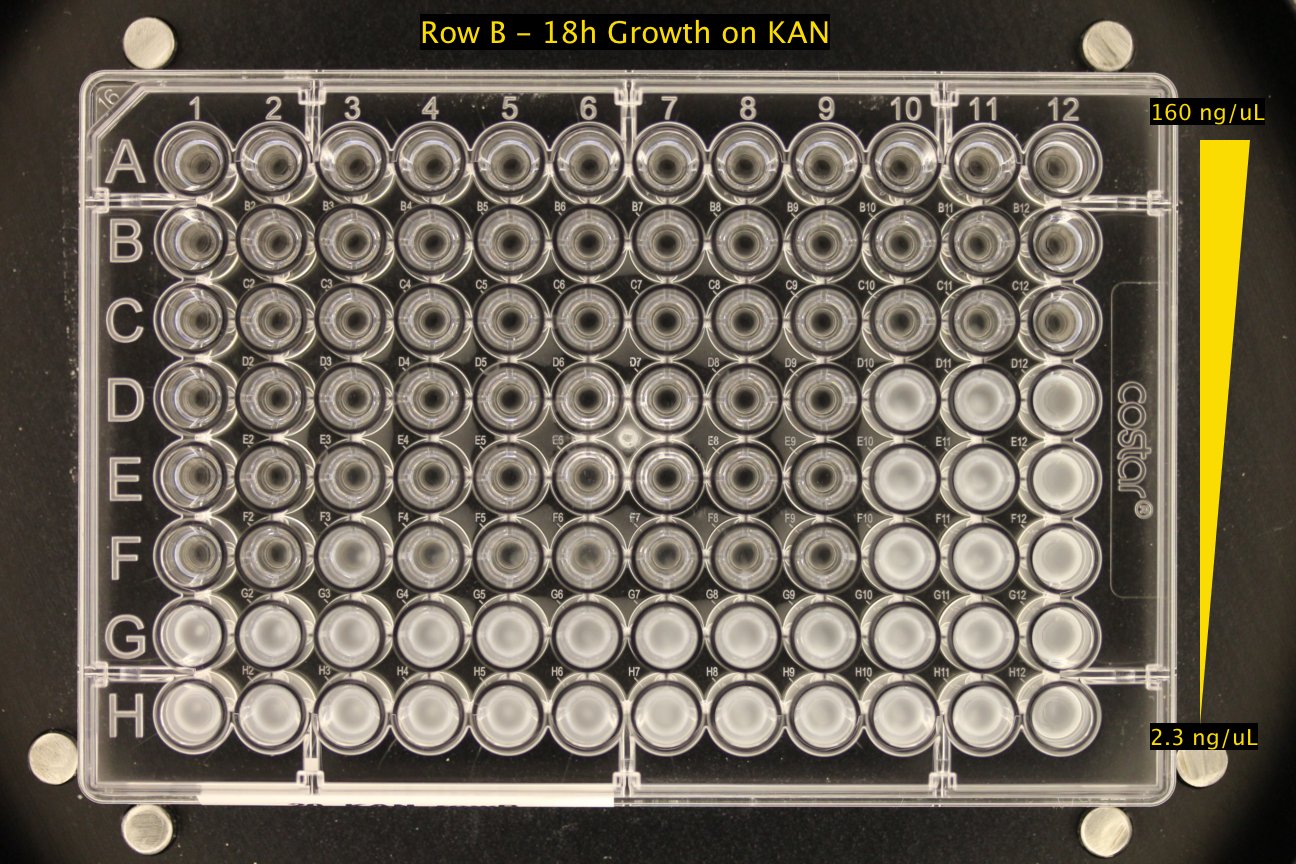
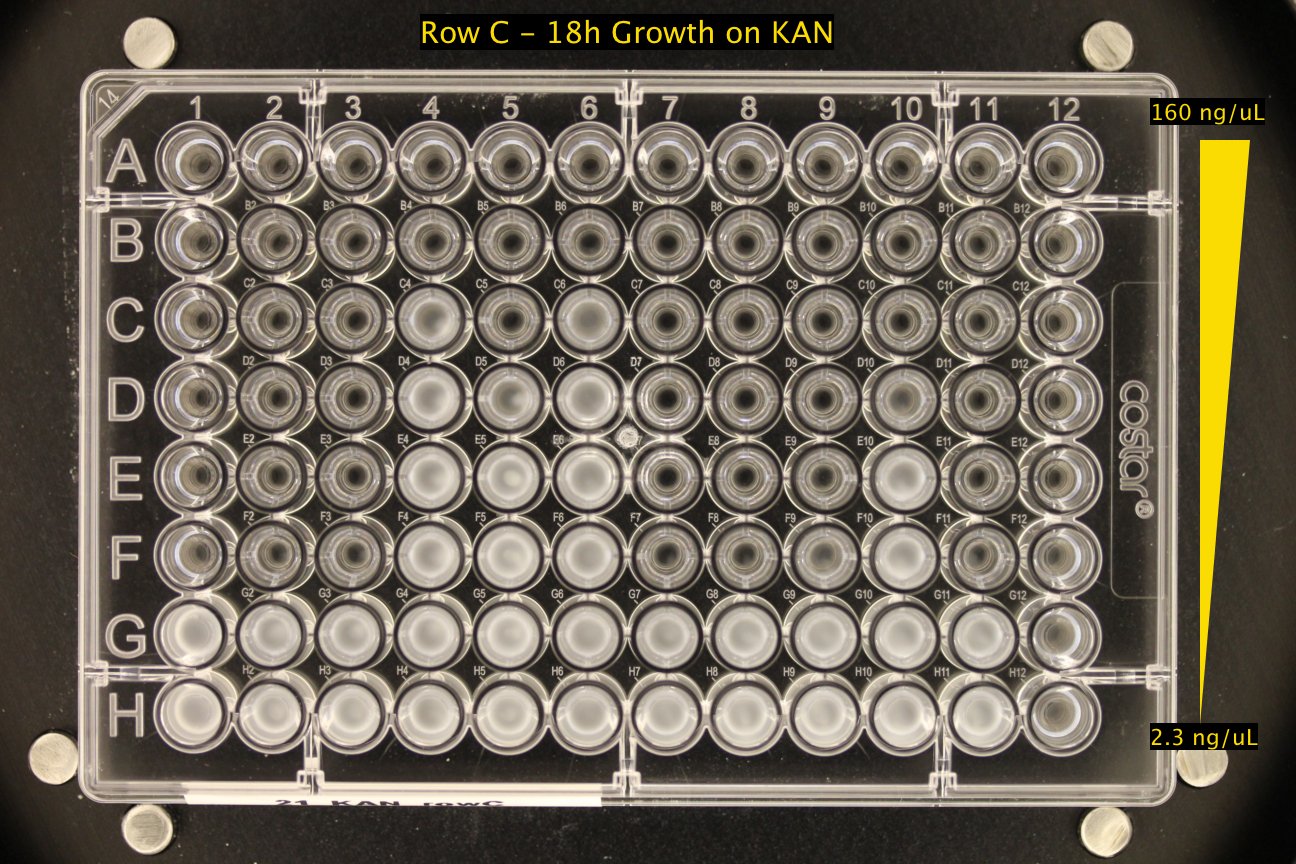
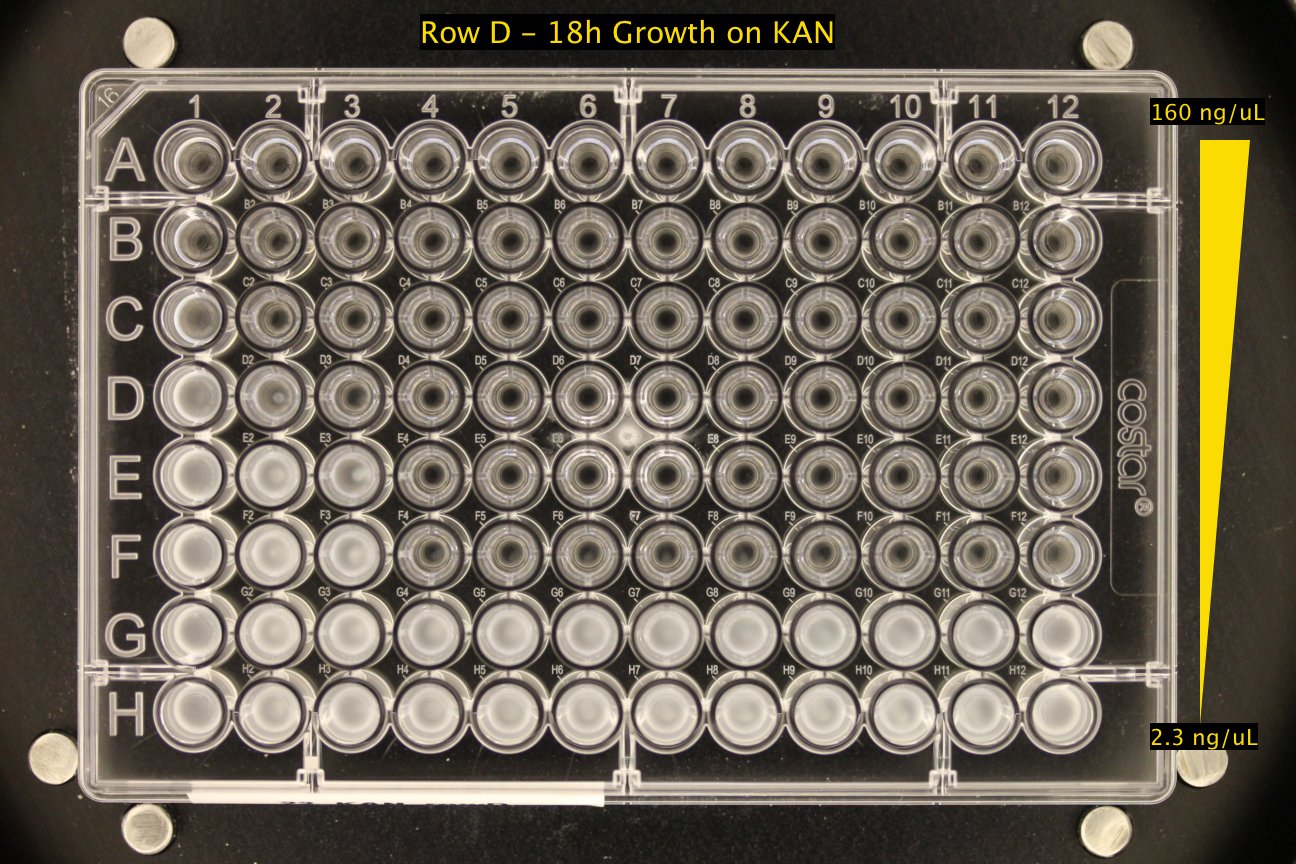
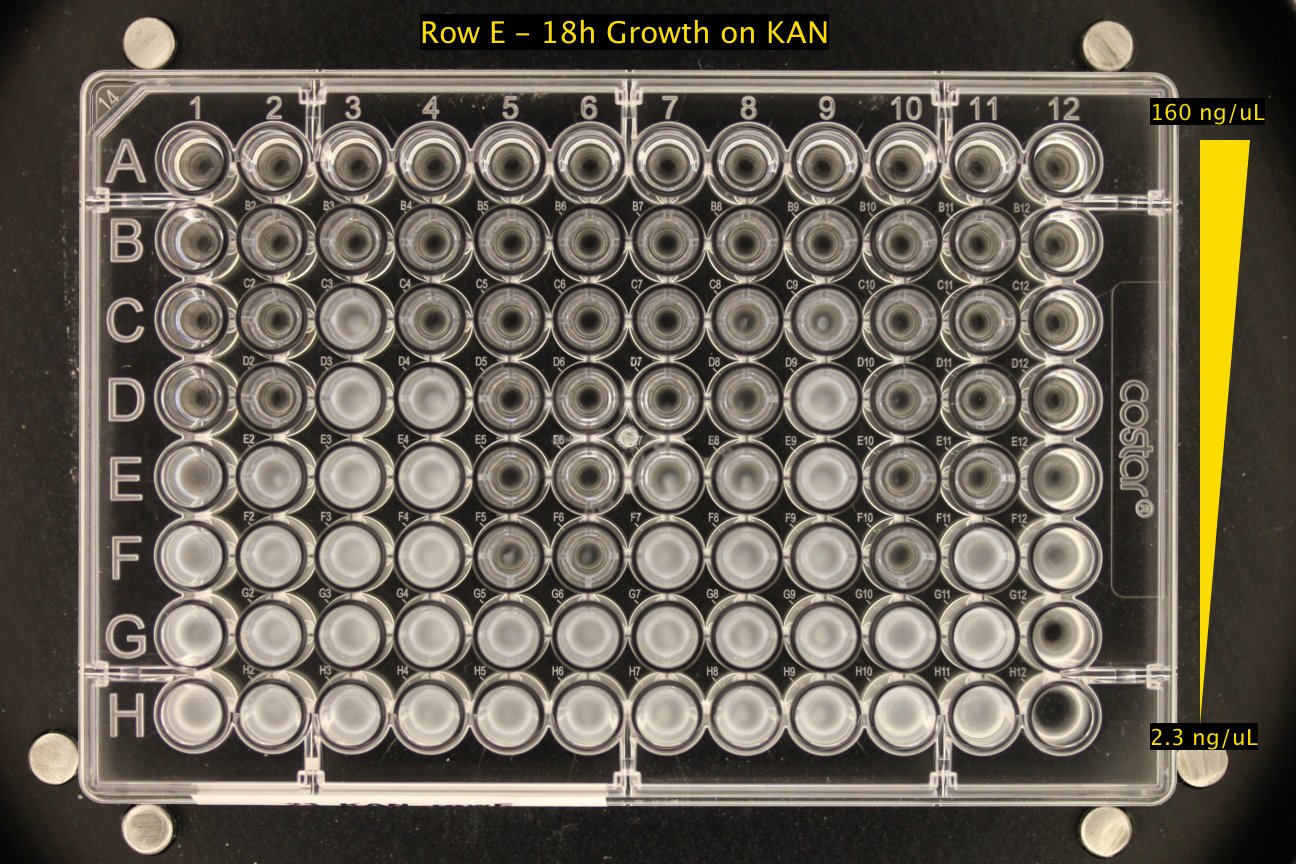
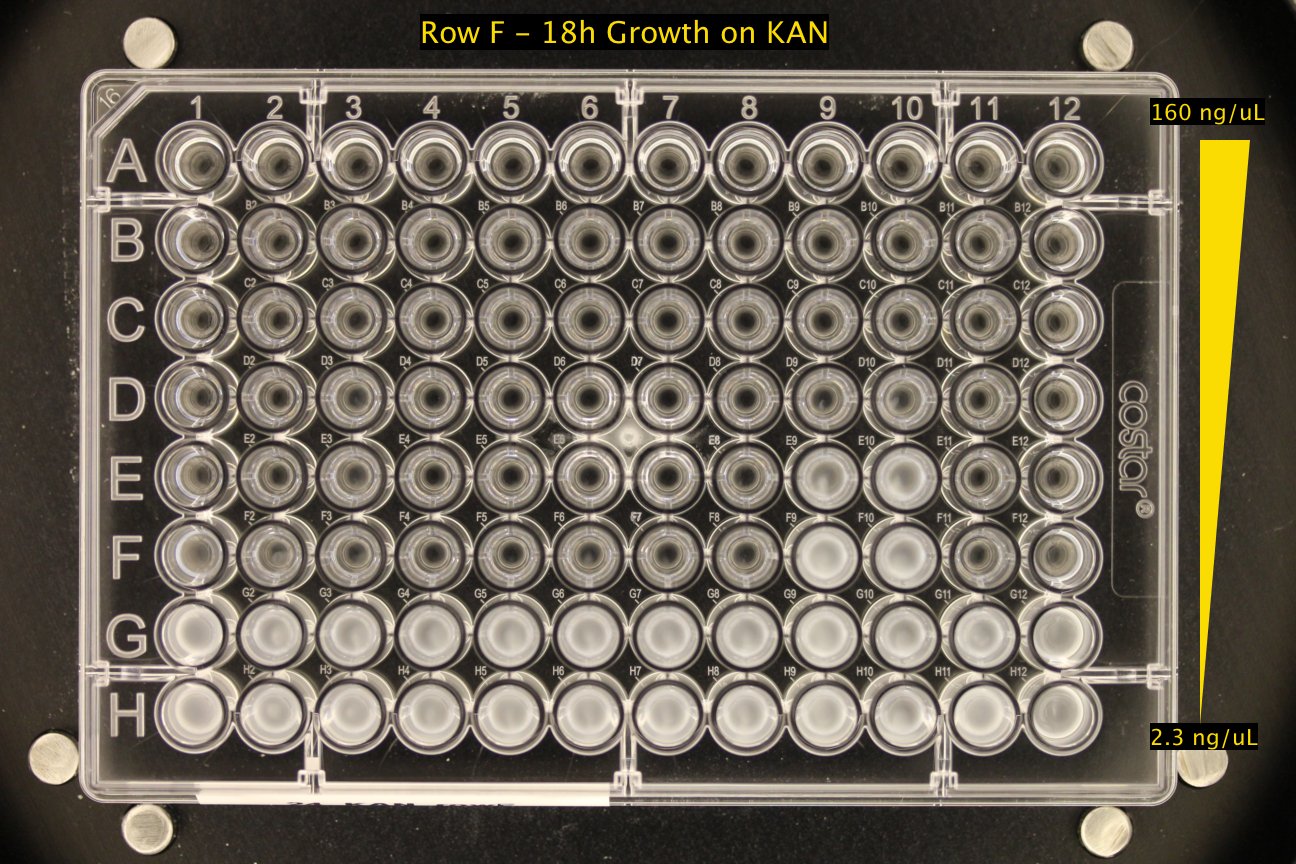
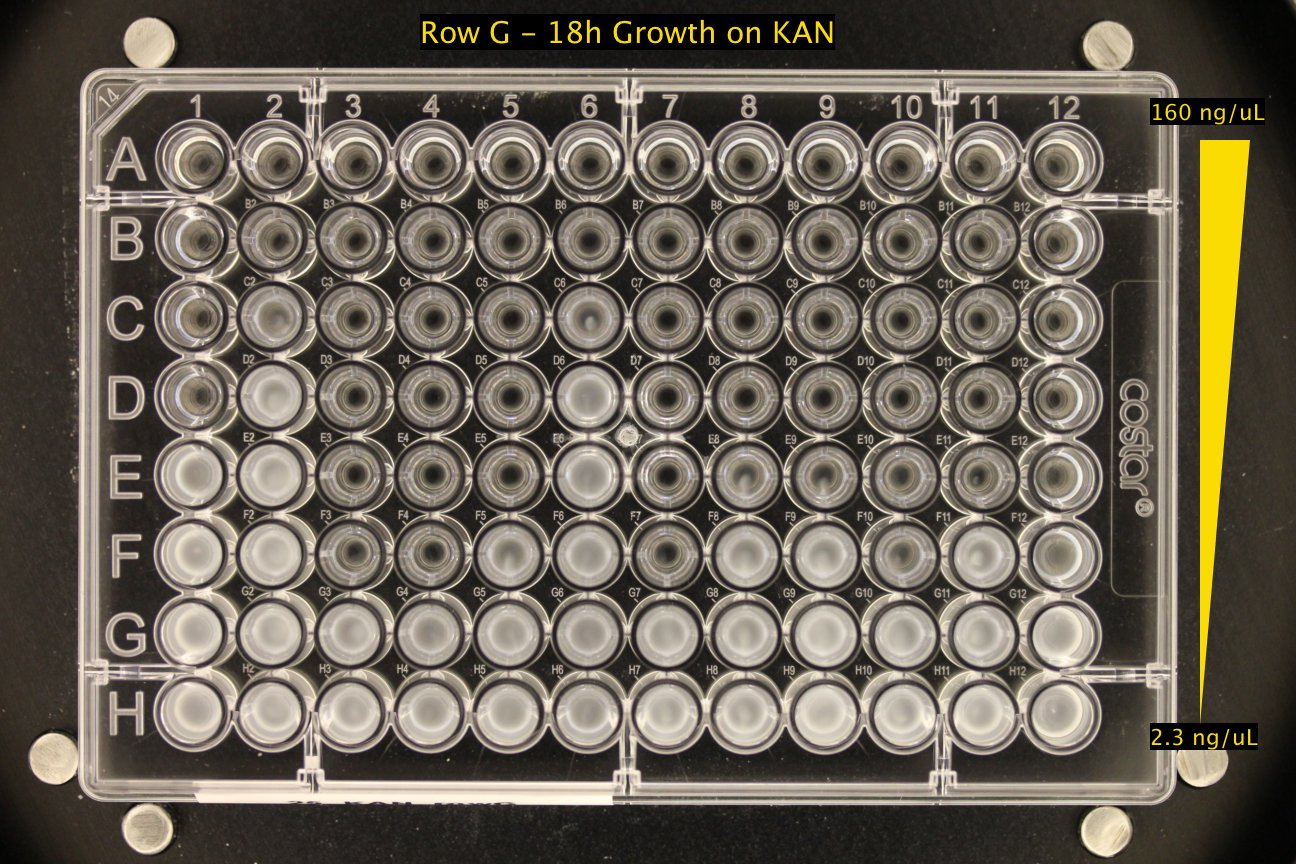
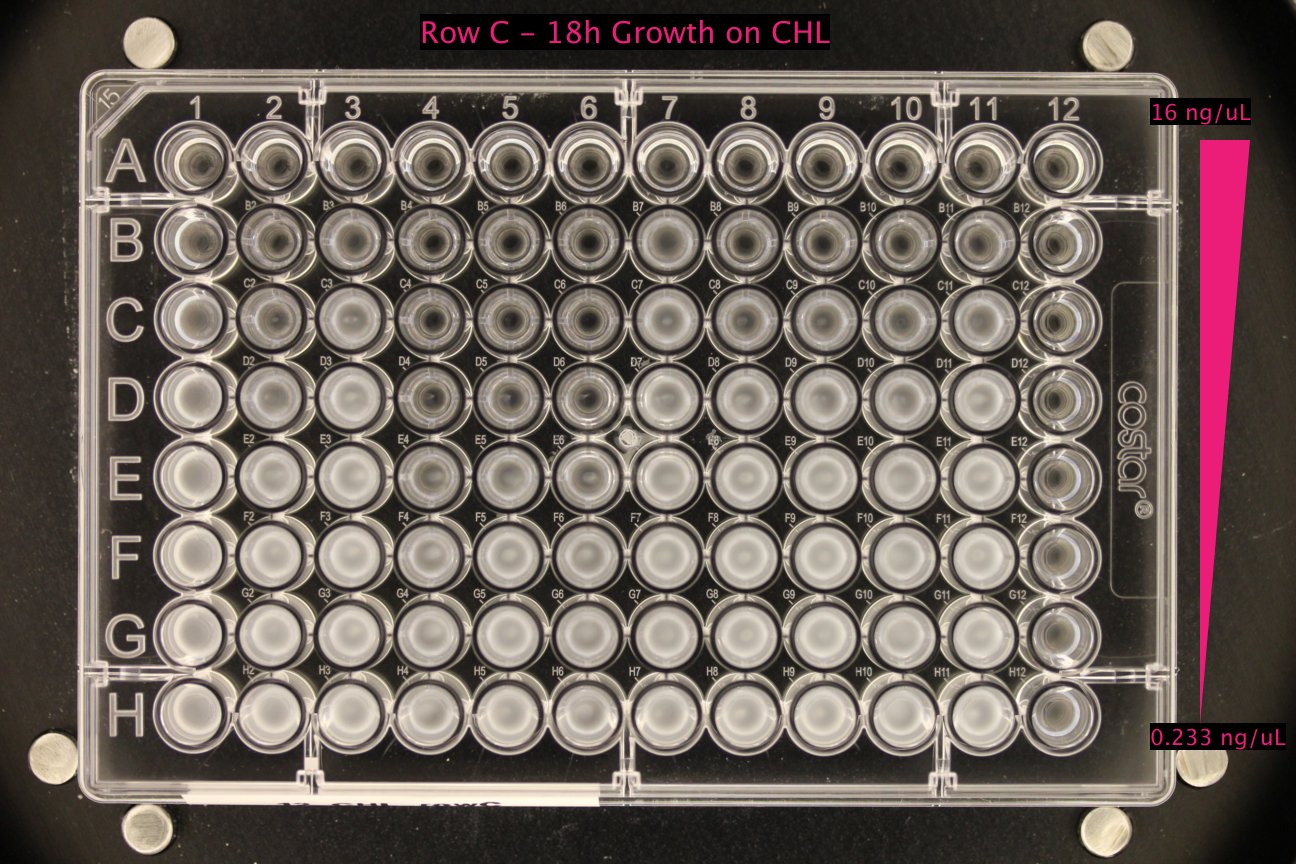
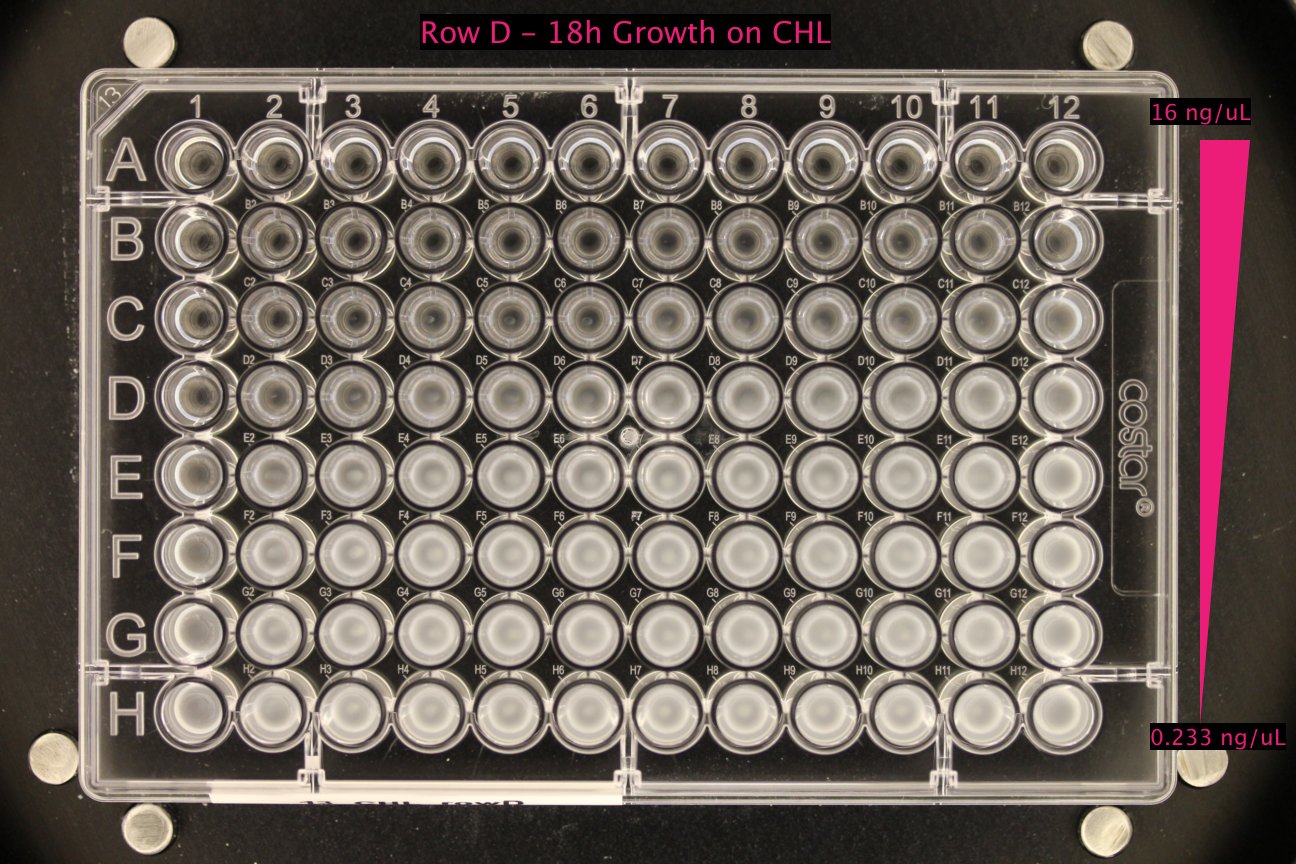
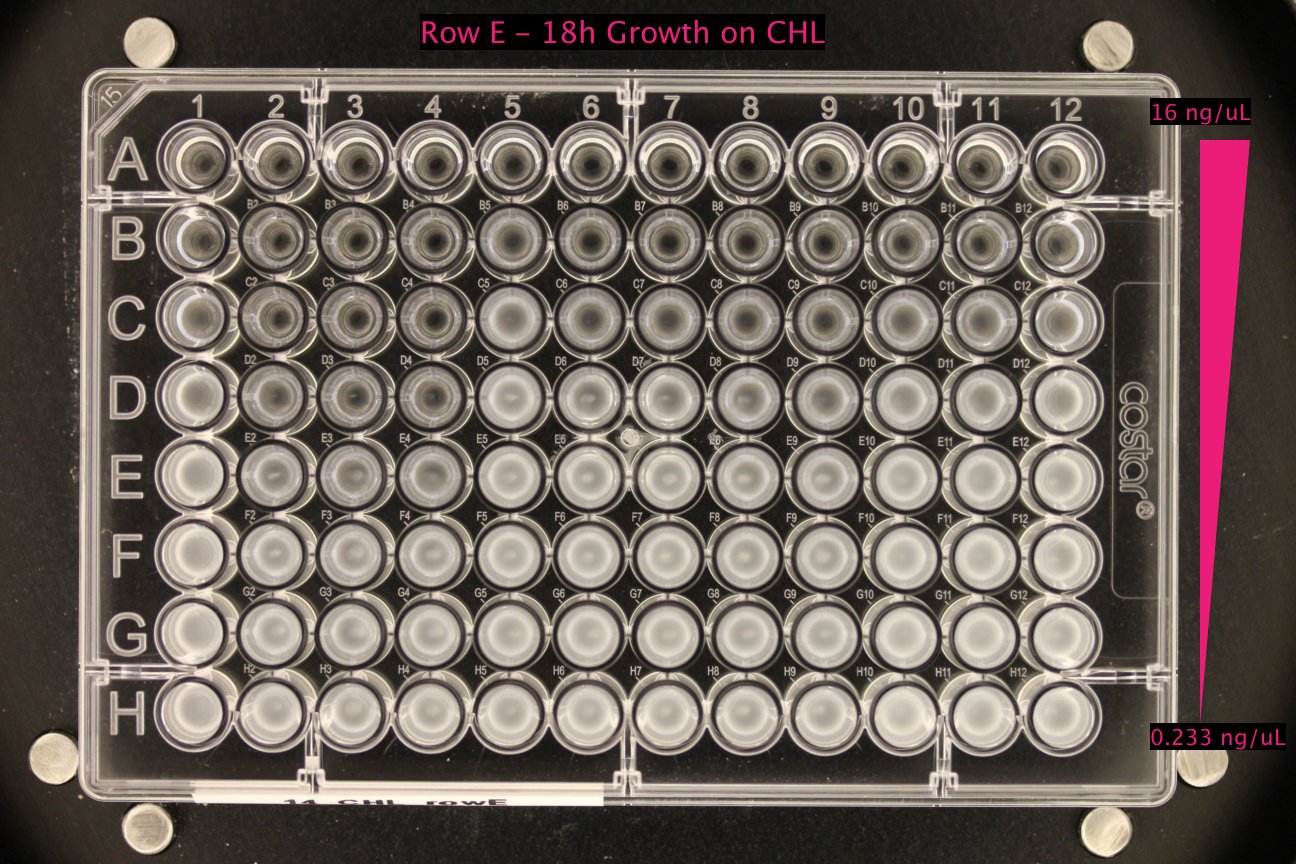
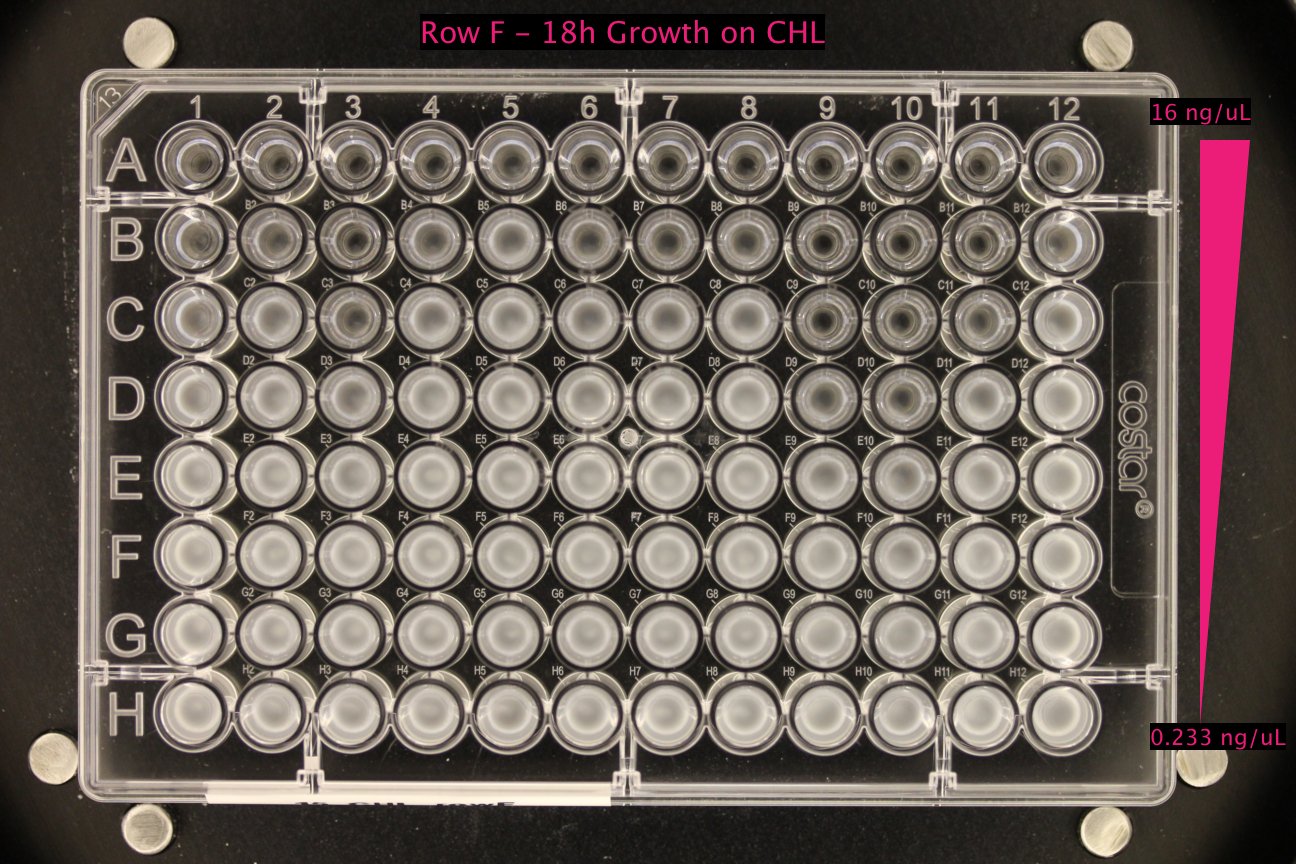
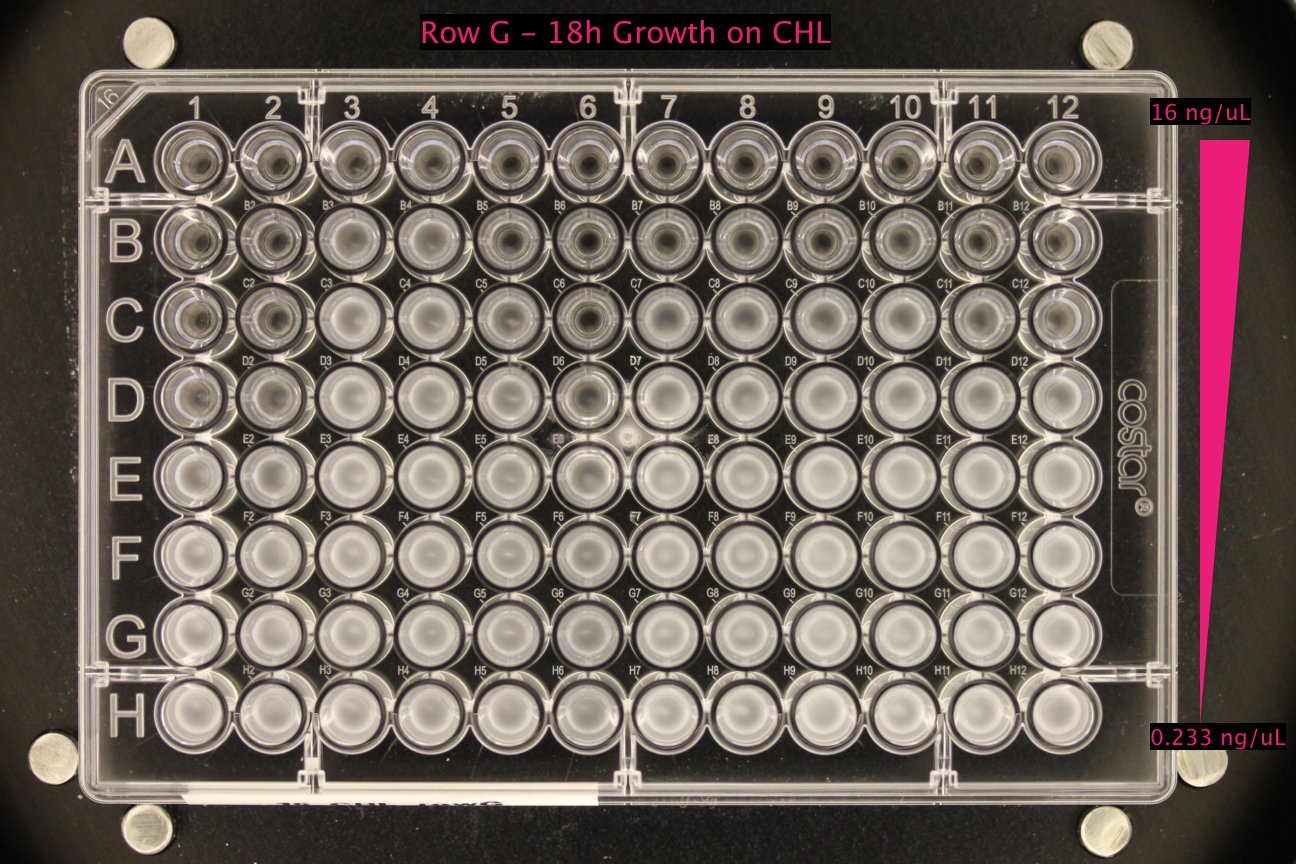
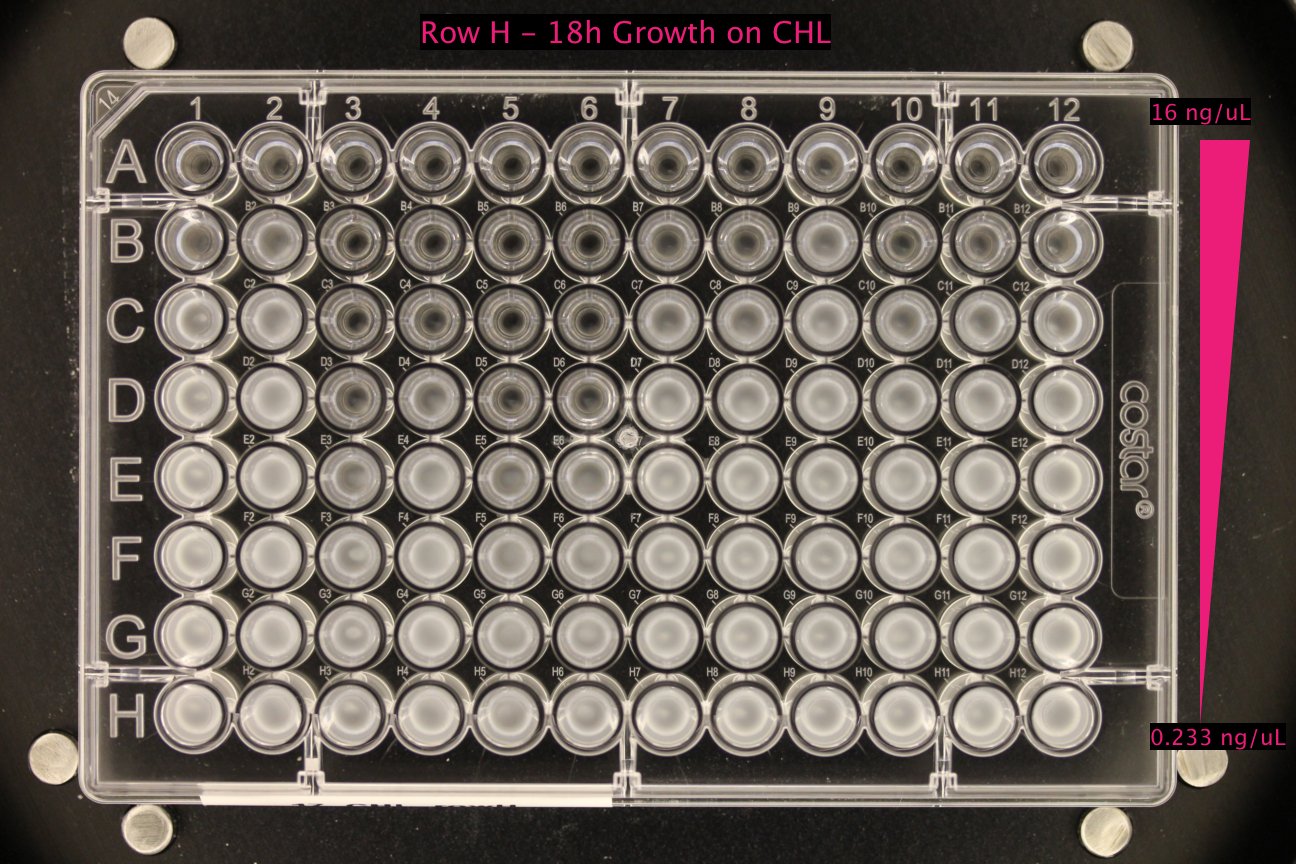
Optical densities after 18h of growth
Each row from the original evolution plate was split into 3 independent plates. Each plate had a single antibiotic with decreasing antibiotic concentrations (highest levels in row A, lowest in row H). The photos allow observing the level of drug resistance.